Machine Learning Cheat Sheet: selection of models
Which of the supported models is suitable for my problem? This question is frequently asked. The following information is intended to assist you in selecting suitable algorithms.
Type of input data of the model
The first essential question concerns the type of input data of the model: image data, time series or tabular data?
 | The supported models are mainly suitable for tabular data. This means that the input of the model forms an array of values. |
Image data
Convolutional Neural Networks (CNNs) are usually used for the direct processing of image data. These are expected to be supported starting from Q3/2023. MLPs can also deliver adequate results for a restricted application area. For this purpose, an image pixel is input into the model as a vector.
In addition, it is expedient to extract features from the image data first and to use these features as the input data of an AI model. TwinCAT Vision provides a powerful library for image capture, preprocessing and feature generation. The features can then be combined as an array and the problem interpreted as a tabular data problem.
Time series
Recurrent neural networks such as the LSTM are usually used for the direct processing of time series, i.e. series of data points in which the temporal sequence of the samples carries essential information. These are expected to be supported starting from Q3/2023. MLPs can also deliver adequate results for a restricted application area. N-samples are input into the model as vectors.
In addition, it is expedient to extract signal features from the time series and to use these features as the input data of an AI model. PLC libraries such as the Condition Monitoring library or the Analytics library are suitable for the feature generation of time series. In practice it has proven to be very efficient, for example, to form static variables over a defined time segment, such as mean value, standard deviation, maximum and minimum value, etc. The time segment might be the length of a process step, for example from the start to the end of a cut, or from the start to the end of a bending process. In addition to static variables, frequency-based features such as the signal power in defined frequency bands have proven to be useful, especially with rotary processes. The generated features are then combined in an array and used as the input for the AI model. Accordingly, the problem can be interpreted as a tabular data problem.
Tabular Data
Tabular Data can be used directly as the input for most AI models. Situations where an array of input data are directly available could be: the length, width and mass as well as its optical components in R, G and B values are measured with different measuring instruments. The values can be directly combined as an array of 6 elements and used as the input for an AI model – for example, for classification as OK or NOK.
Description of the goal
Once the type of input data has been defined, the question arises as to what exactly the AI should do, or what it can do under given conditions. Do annotated (labeled) data exist and what type are the labels?
Clustering
In clustering, the inner structure of the input data are analyzed. No annotated data are necessary for the cluster analysis; however, the number k of the expected clusters must be known.
Anomaly detection
A popular application, likewise for the case that no annotated data exist. In the training phase, only data that can be described as “normal” are presented to the model. In the inference phase, the model can distinguish between a known input data structure and an unknown input data structure. In the latter case an anomaly is assumed. The challenge in anomaly detection is the preprocessing of the training data, so that if possible only the normal case is used in the training, as well as the limited meaningfulness of the result.
Dimensionality reduction
Human beings are good at visualizing the 2- and 3-dimensional space. Point clouds in a 3D plot are easy to handle and can improve the understanding of processes. However, it quickly becomes confusing if several dimensions are involved. The purpose of dimension reduction is to map an N-dimensional input vector to a smaller vector while losing the least possible amount of information: for example, a 10-dimensional input is reduced to 3 dimensions while retaining 95% of the information. Redundant information of the input data is exploited. The dimension reduction is well suited for use as a feature generation step, e.g. before a classifier.
Regression
A regression problem requires the existence of an annotated data set. As a rule, a problem is described with N REAL or LREAL as the input of the model and M REAL or LREAL as the output.
Example: N features are created during a forming process (e.g.: maximum, standard deviation, skew of the servo motor current). For each of these features, the resulting diameter of the formed product in the longitudinal and transverse direction is known. From the 3 features, 2 values are estimated accordingly.
If the curve of a time series is to be modeled, the N past time values can be used as the input vector and the N+1 value as the label. The manual labeling of the data is thus unnecessary.
Classification
A classification problem requires an annotated data set. As a rule, N REAL or LREAL values are mapped here to a category that is usually represented as INT in TwinCAT. For example, whether a finished product corresponds to quality class A, B or C is calculated from N features.
Explainability of an AI model
In some situations it is of great importance to be able to explain the results of an AI model, i.e. to answer the question, for example, as to why a model has classified a product as defective. Unfortunately, most algorithms work like black boxes, and the results can only be explained with difficulty if at all – even if they are very precise. Decision Trees are models that can be explained very well, because the path through the tree can be retraced with the individual limit values of the branches. However, the accuracy of these models is often not as convincing as with other models that cannot be explained.
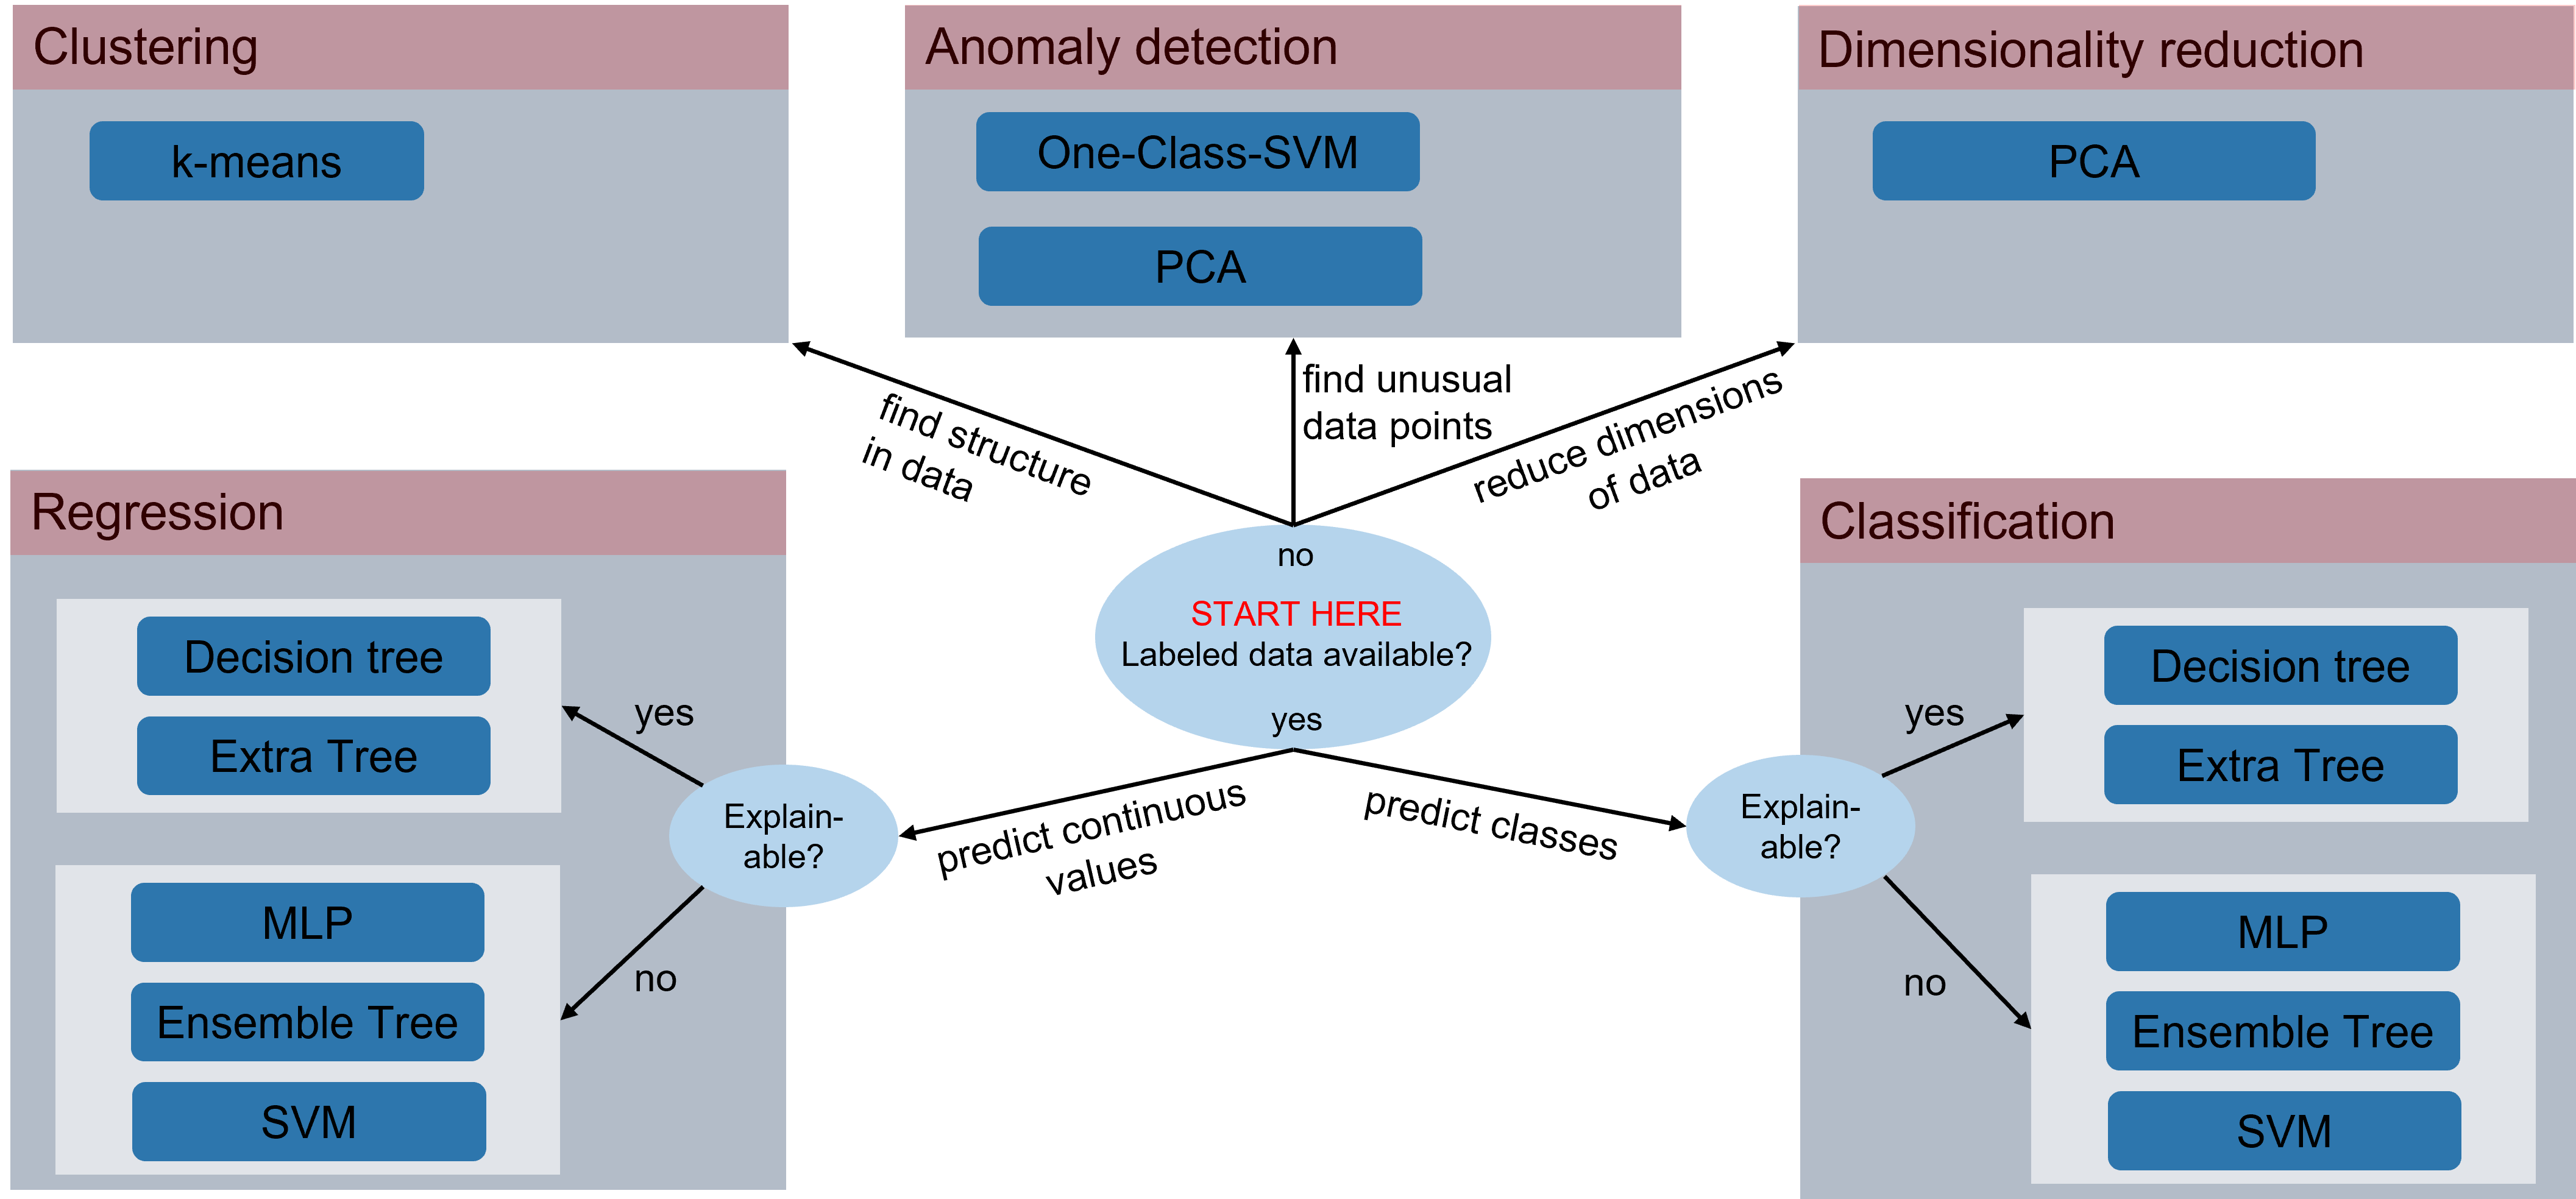
AI model Cheat Sheet
The following figure provides a simple guide to the selection of a suitable AI model. It illustrates the classification of AI models for different application purposes, provided the model input is tabular data.