Filter types and parameterization
 | This description is limited to low-pass filters. However, the concepts can be applied to other filter types (high-pass, band-pass and stop-band filters). |
| TwinCAT Filter Designer The graphics created in the following were created with the TwinCAT Filter Designer. The Filter Designer makes it possible to create filters graphically and then use them in the PLC with TwinCAT 3 Filter (or as a filter directly on the EtherCAT Terminal or Drive). |
The Butterworth filter, the Chebyshev filter and the Bessel filter are common implementations of a digital filter. Each filter has certain properties that are beneficial in different situations.
Butterworth filter vs. Chebyshev filter:
The difference between the two implementations essentially consists of the balance between the permissible ripple of the amplitude response in the passband and the slope of the amplitude response in the transition between the passband and the stopband. While the Butterworth filter has a maximally flat amplitude response in the passband, for the Chebyshev filter the permissible ripple of the amplitude response in the passband is specified as a parameter. The advantage of the Chebyshev filter is a steeper decrease of the amplitude response in the transition from the passband to the stopband.
Bessel filter vs. Chebyshev and Butterworth filters:
In the Bessel filter, the focus is on a constant group delay or a linear phase response in the passband of the filter. As a result, the shape of signals with spectral components in the passband is not changed when passing through the filter. Compared to the Butterworth or Chebyshev filter, the transition from the passband to the stopband is less sharp in the Bessel filter, i.e. amplitudes near the cut-off frequency are comparatively less attenuated. In the passband itself, the Bessel filter exhibits a monotonically decreasing amplitude response.
The filter types are compared and described in more detail below. First, some basic terms are explained briefly.
Transfer function in the amplitude/frequency diagram
The filter is described mathematically by the transfer function (see Digital filters). The transfer function can be displayed in the form of an amplitude and a phase response.
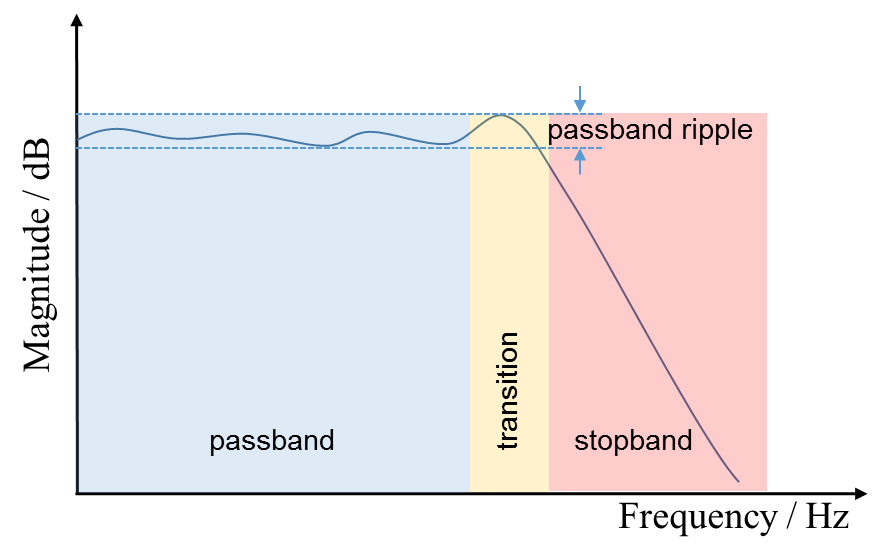
Graphical representation of the amplitude response of a low-pass filter
Passband
The passband (blue zone) allows spectral components of a signal to pass through. Modification of the signal in this frequency range should be avoided.
Stopband
In the stopband (red zone), the filter attenuates the corresponding frequency components of the signal.
Transition
The transition (yellow zone) separates the passband and the stopband. It should normally be as small as possible. The design of the transition phase is a defining criterion for the selection of the filter type and its parameterization.
Passband ripple
The ripple in the passband describes the waviness of the amplitude response in the passband.
Parameterization of the Butterworth filter
Properties
The amplitude response of the Butterworth filter is maximally flat in the passband, so that the wanted signal in this range is only minimally manipulated. In addition, the entire course of the amplitude response is monotonous, i.e. without passband ripple. This filter type is one of the most frequently used filter types.
Parameter
The transfer function of the Butterworth filter contains only two parameters to be defined: the cut-off frequency and the filter order.
Filter order
The filter order determines how steeply the amplitude response decreases in the transition. The higher the filter order, the steeper the amplitude response decreases and the smaller the transition. For the slope of the amplitude response for a Butterworth filter, -n * 20 dB/decade, with n = order, i.e. -20 dB/decade for filter order 1, -40 dB/decade for filter order 2, and so on.
Cut-off frequency
The cut-off frequency of the Butterworth filter is defined as the frequency at which the normalized amplitude response assumes the value 1/sqrt(2) ≈ -3 dB. This applies to all filter orders. Accordingly, when designing the filter, care must be taken to ensure that the spectral components of a signal are already attenuated by 3 dB at the cut-off frequency. This parameter causes a parallel shift of the amplitude response along the frequency axis (distortion due to the logarithmic frequency axis).
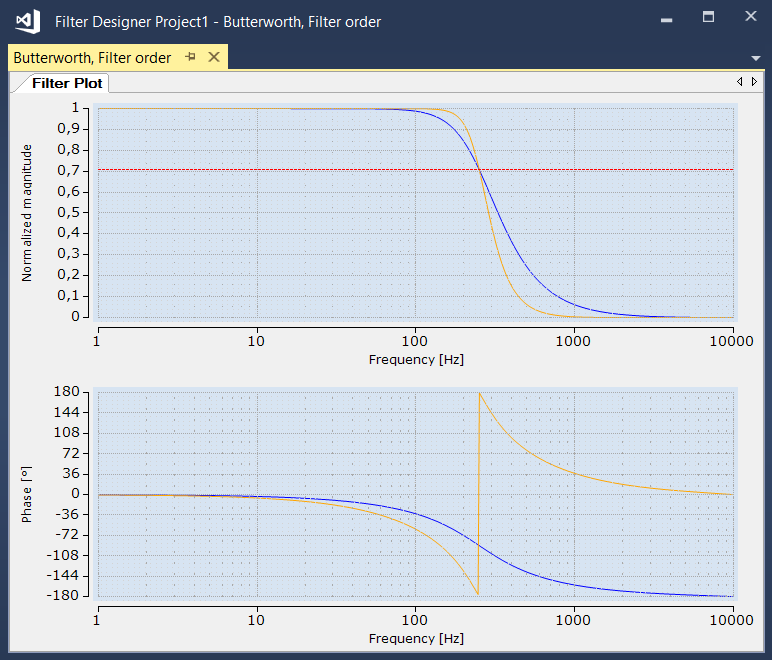
Graphical representation of the amplitude and phase response of a Butterworth filter with identical cut-off frequency (blue: filter order 2, yellow: filter order 4)
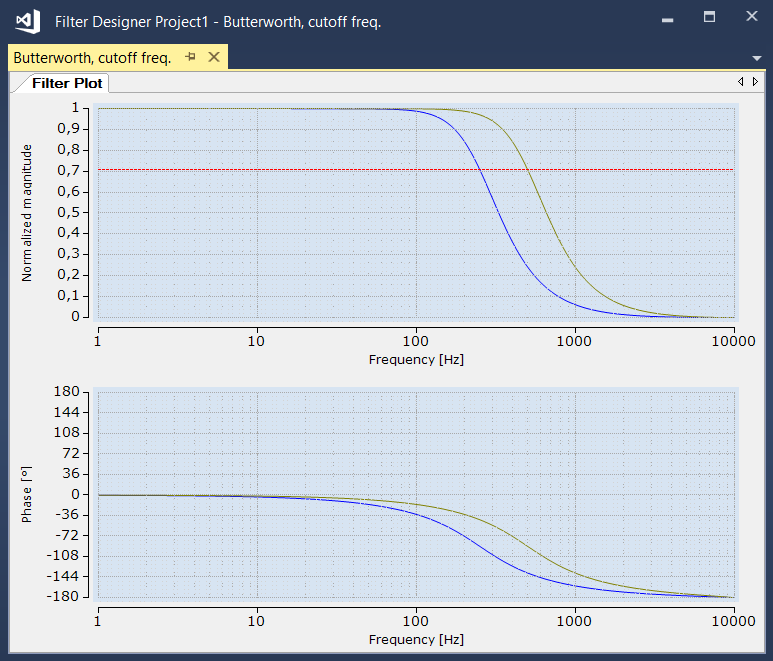
Graphical representation of the amplitude and phase response of a Butterworth filter with identical filter order (blue: cut-off frequency 400 Hz, green: cut-off frequency 700 Hz)
Parameterization of the Chebyshev filter
Properties
The amplitude response of the Chebyshev filter has a parameterizable passband ripple. However, the amplitude response decreases steeply in the transition even at low filter order. The following applies: the greater the permissible passband ripple, the shorter the transition.
Parameter
In addition to the filter order and the cut-off frequency as parameters to be defined, the transfer function of the Chebyshev filter contains a "passband ripple" parameter.
Passband ripple
The parameter specifies the permissible ripple of the amplitude response in the passband of the filter. By allowing a passband ripple, a short transition between passband and stopband, and thus a steep decrease of the amplitude response, can be achieved with a significantly lower filter order.
Cut-off frequency
The cut-off frequency of the Chebyshev filter is defined as the frequency at which the amplitude response passes downwards through the defined "passband ripple". The position of the transition on the frequency axis is thus associated not only with the cut-off frequency, but also with the settings for the filter order and passband ripple.
The following diagram shows three different Chebyshev filters with different filter order and passband ripple, but the same cut-off frequency.
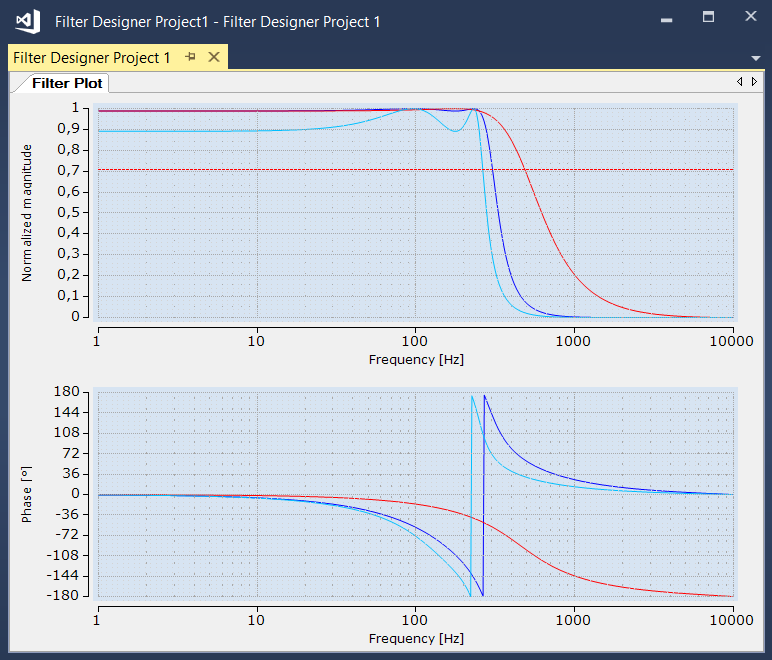
Graphical representation of the amplitude and phase response of a Chebyshev filter with identical cut-off frequency (blue: filter order 4, passband ripple 0.1 dB, red: filter order 2, passband ripple 0.1 dB, cyan: filter order 4, passband ripple 1 dB)
Filter order
The filter order determines how steeply the amplitude response decreases in the transition. The higher the filter order, the steeper the amplitude response decreases and the smaller the transition. For the slope of the amplitude response for a Butterworth filter, -n * 20 dB/decade, with n = order, i.e. -20 dB/decade for filter order 1, -40 dB/decade for filter order 2, and so on.
The filter order does not influence the cut-off frequency according to the above definition, as can be seen in the following graph. The amplitude response curves intersect at the cut-off frequency of 250 Hz.
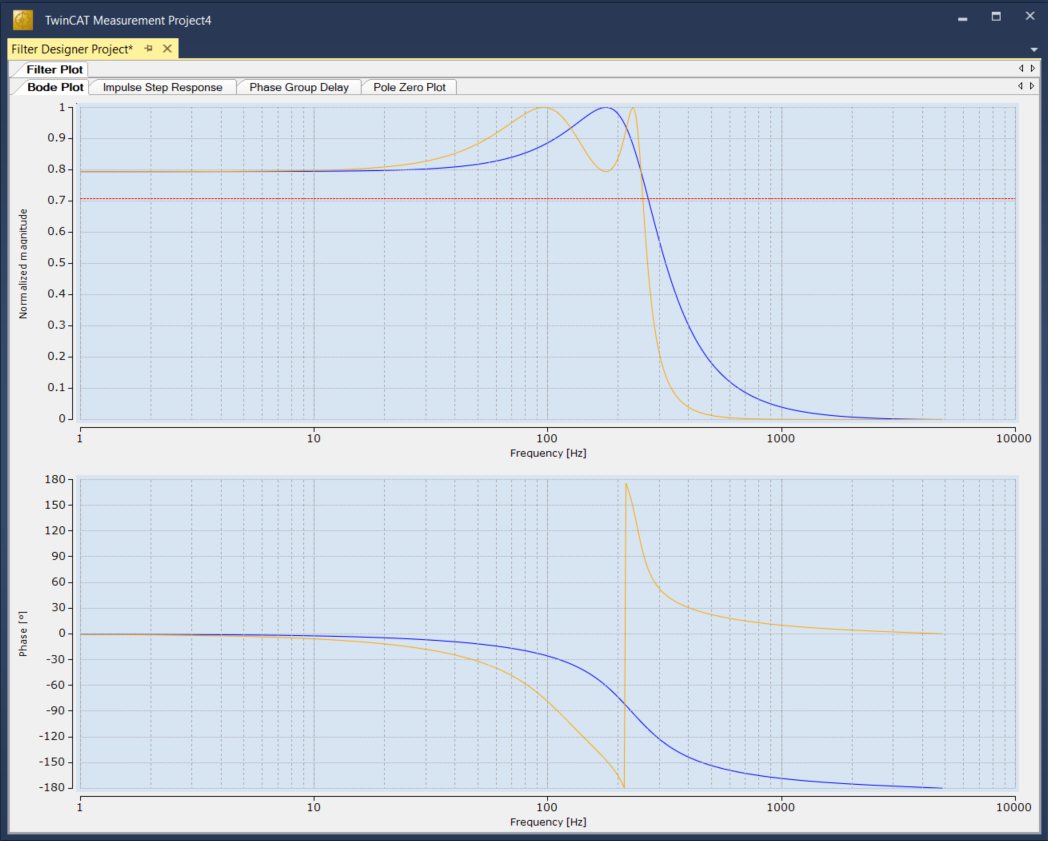
Graphical representation of the amplitude and phase response of a Chebyshev filter with identical cut-off frequency (250 Hz) and identical passband ripple (2 dB): (blue: filter order 2, yellow: filter order 4)
Comparison of Butterworth and Chebyshev filters
The following diagram shows a direct comparison of the amplitude and phase response of a Butterworth filter and a Chebyshev filter. Both filters are parameterized so that their amplitude responses intersect at the cut-off frequency of the Butterworth filter at a normalized amplitude of 1/sqrt(2). Both filters are defined as fifth order filters. The passband ripple parameter of the Chebyshev filter is 0.5 dB.
The weighing up referred to above between the permissible passband ripple of the amplitude response and the slope in the transition with the same filter order becomes apparent. With the same filter order, the amplitude response of the Chebyshev filter decreases more sharply in the transition than that of the Butterworth filter. On the other hand, its amplitude response is not smooth in the passband, so that the wanted signal is manipulated more strongly here than with the Butterworth filter.
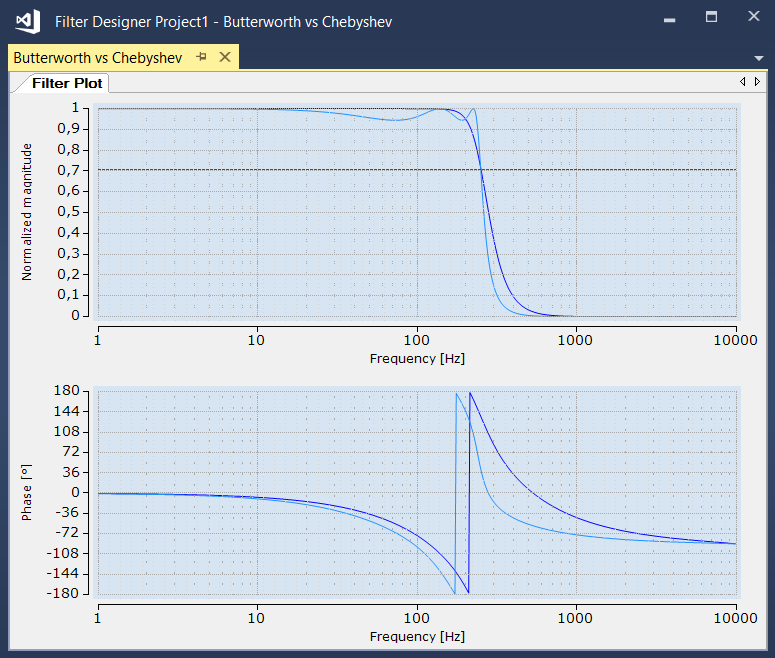
Graphical representation of the amplitude and phase response of a Butterworth filter (blue) and a Chebyshev filter (cyan)
Parameterization of the Bessel filter
Properties
The Bessel filter has a constant group delay in the passband. The amplitude response is monotonically slightly decreasing. Due to these properties, a signal that has only spectral components in the passband will not change in its signal shape when passing through the filter.
Parameter
Like the Butterworth filter, the Bessel filter is parameterized via the cut-off frequency and filter order.
Cut-off frequency
The cut-off frequency fc defines the amount of group delay of the Bessel filter in the passband τgd,pass:

Here fs is the sampling frequency.
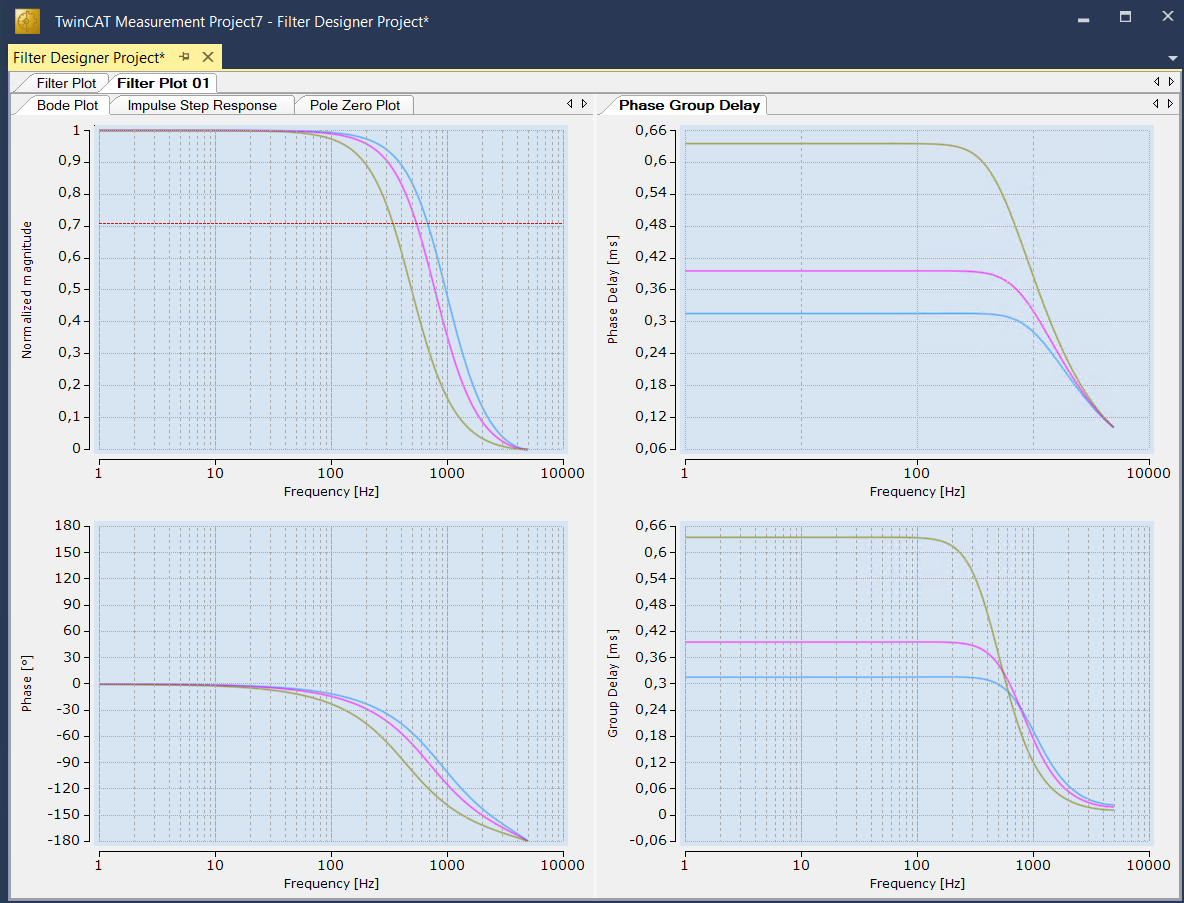
Graphical representation of the amplitude and phase response of a Bessel filter (blue: cut-off frequency 500 Hz, magenta: cut-off frequency 400 Hz, olive: cut-off frequency 250 Hz)
Filter order
The filter order influences the slope of the amplitude response in the stopband. It should be noted with the Bessel filter that an increase in the filter order is accompanied by an increase in the passband. Accordingly, it is advisable to select the order first and then use the cut-off frequency to define the passband.
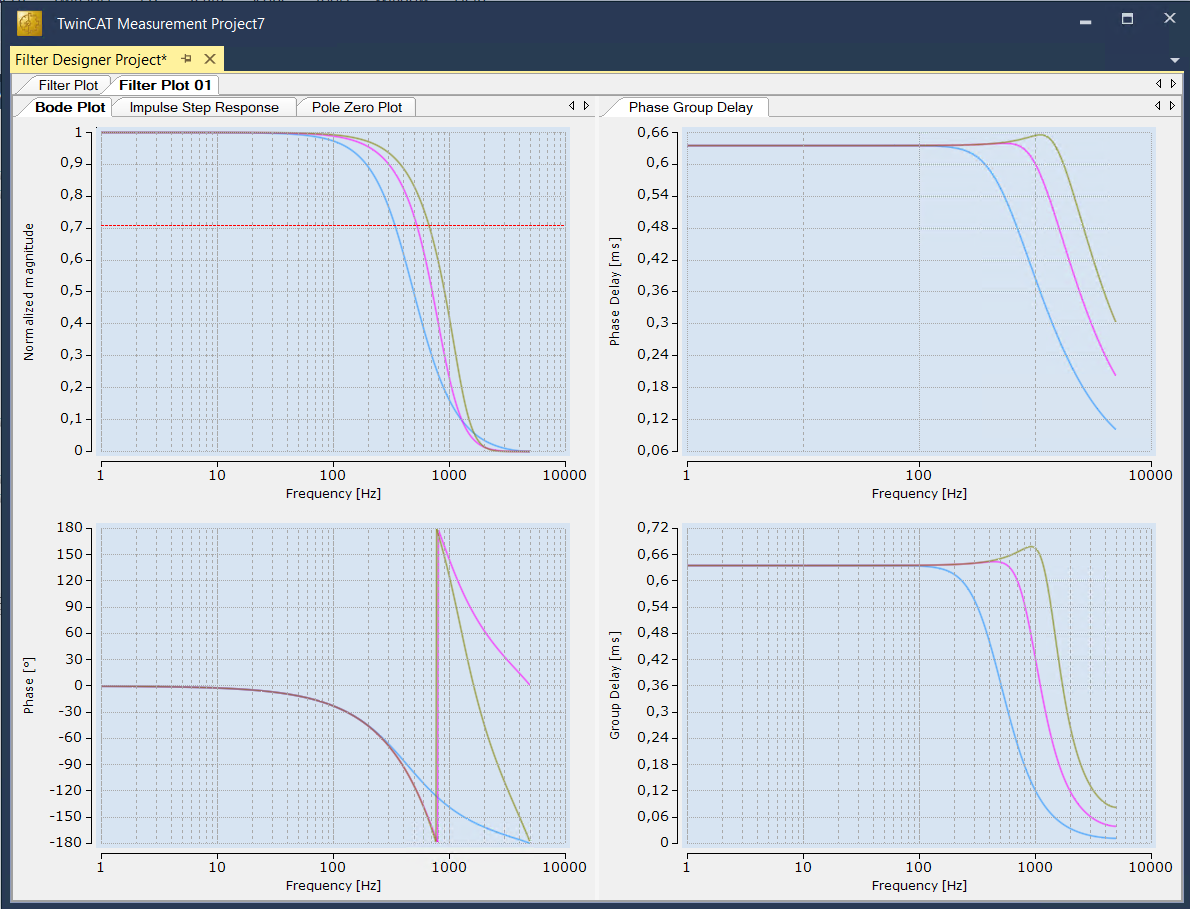
Graphical representation of the amplitude and phase response of a Bessel filter (blue: filter order 2, magenta: filter order 4, olive: filter order 6)
Comparison of Butterworth, Chebyshev and Bessel filters
The main characteristics of the Bessel filter can be seen in the time domain or in the phase and group delay. As shown in the graph below, the impulse response and step response of the Bessel filter do not require much settling. In addition, phase delay and group delay are almost constant in the passband of the filter, which means that signals with spectral components in the passband are not changed in shape.
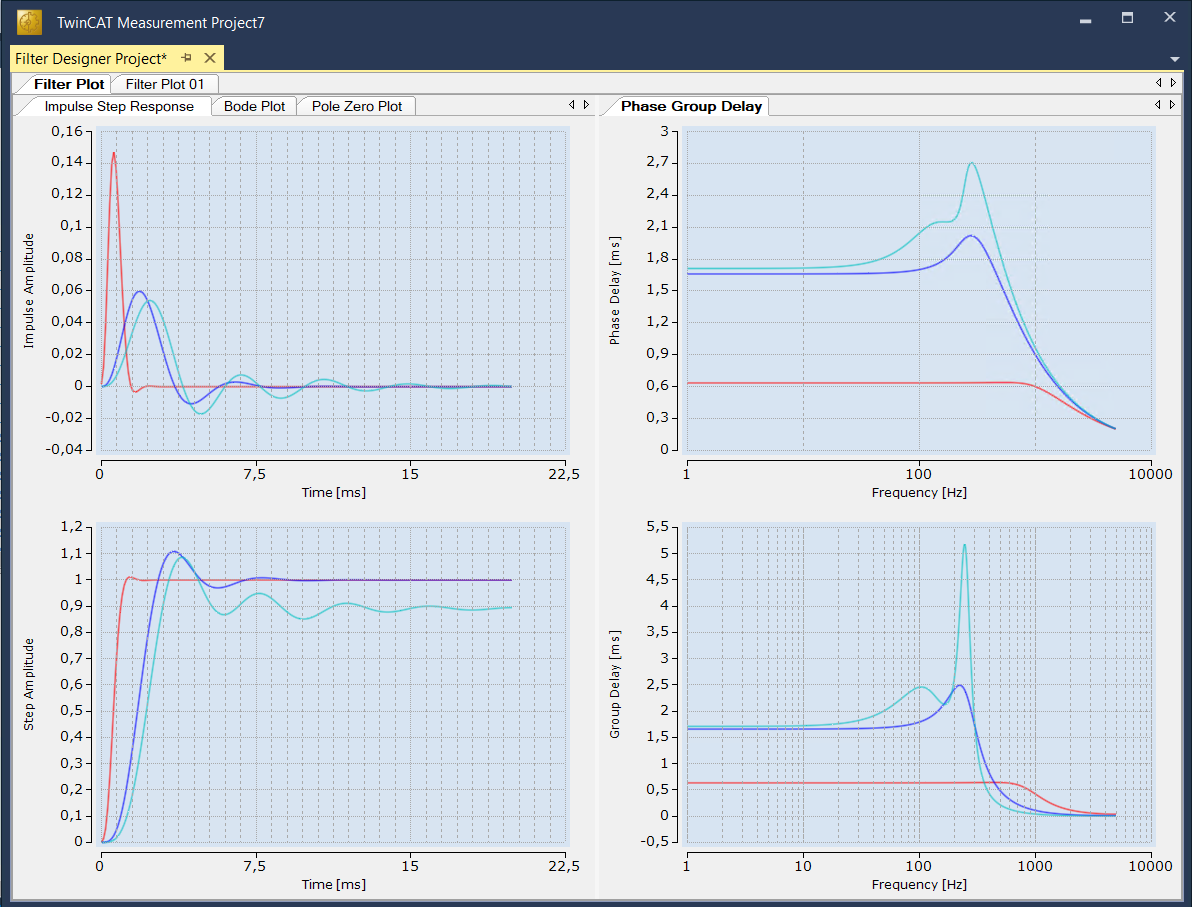
Graphical representation of the impulse and step response as well as the phase and group delay of a Butterworth filter (blue), a Chebyshev filter (cyan) and a Bessel filter (red).