Correlation function
This sample implements examples of the possible uses of the function block FB_CMA_Correlation. Here, the correlation coefficients are calculated for a temporal offset of +/- 100 samples with respect to a reference signal.
The source code for this sample can be downloaded here: Correlation_Sample.zip
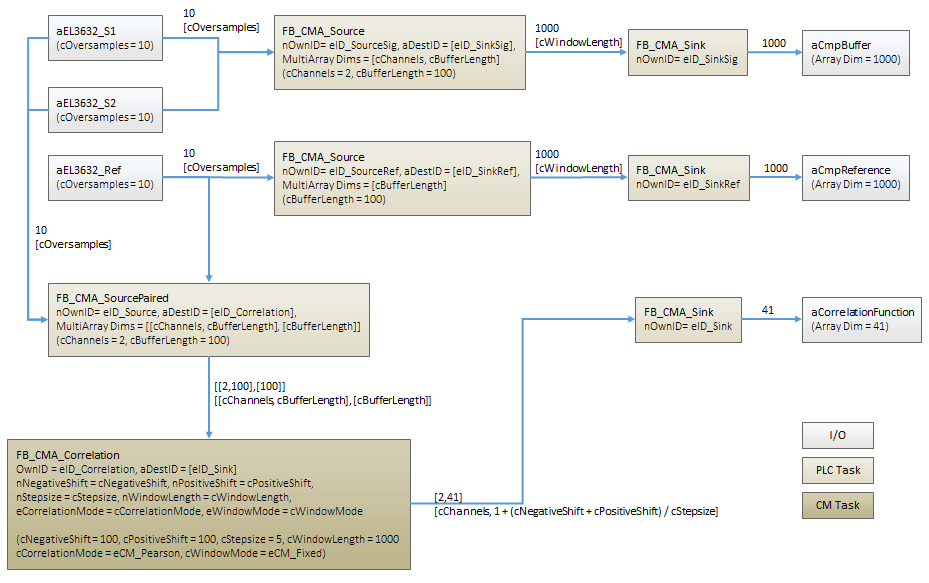
Block diagram
Program parameters
The table below shows a list of the important parameters for configuring the function blocks.
nWindowLength | 1000 |
nNegativeShift | 100 |
nPositiveShift | 100 |
nStepsize | 5 |
eCorrelationMode | eCM_Pearson |
eWindowMode | eCM_Fixed |
Explanations
In this sample, the correlation parameters are calculated between a sine wave with amplitude 1 (red) and a sine wave amplified by +5 ms (50 samples at 10 kHz sampling rate) (blue) and a triangular pulse (green) with an identical frequency (50 Hz) and a delay of -5 ms. The test signals are superimposed with normal noise. The following graphic shows the output signals (above) and the noisy signals (below)
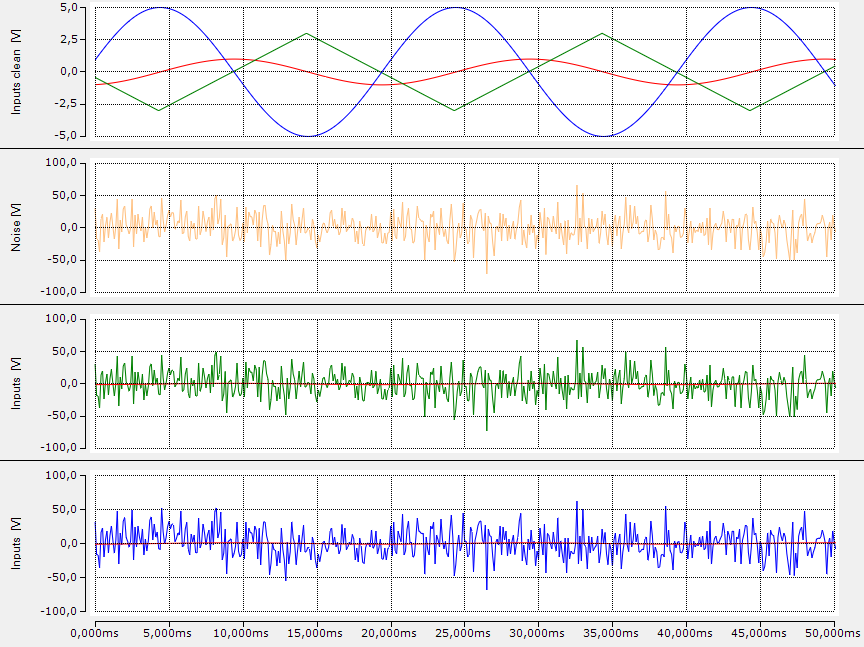
The noise is made so high that the output in the time domain can no longer be identified. However, the calculation of the correlation coefficients allows the classification in relation to the reference signal:
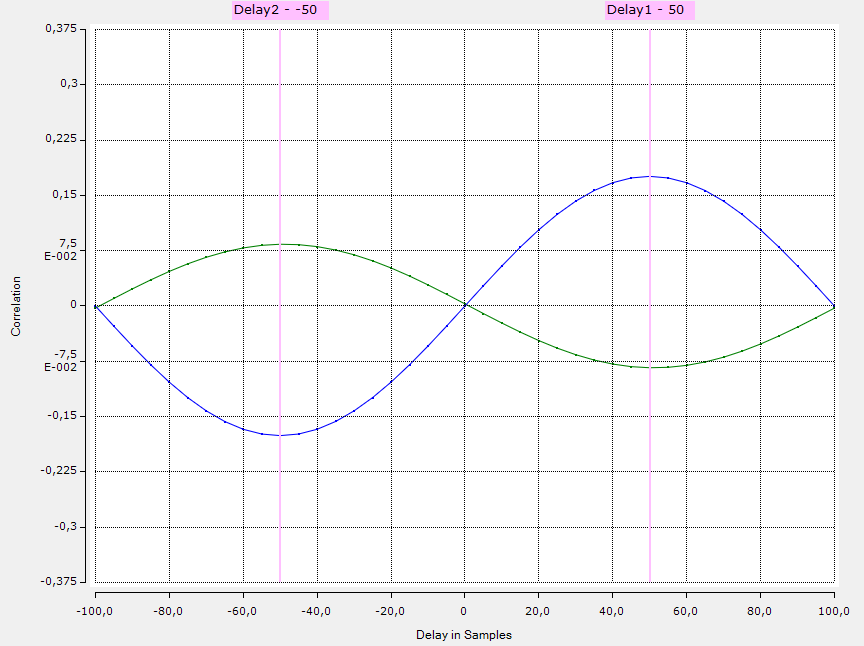
The highest correlation of the amplified sine wave (blue) is at a shift of 50 samples to the reference, i.e. the signal is delayed by 5 ms. Analogously, the triangular pulse (green) is shifted by 50 samples, i.e. it leads the reference by 5 ms.
Requirements
Development environment | Target platform | PLC libraries to include |
|---|---|---|
TwinCAT v3.1.4022.25 | PC or CX (x86, x64) | Tc3_CM, Tc3_CM_Base |