Spike Energy Spectrum
This sample implements a way to analyze bearing damage by looking at high-frequency components in the vibration data. Due to the sensitivity of the peak energy in comparison with a real setup, the energy of the simulated shocks was chosen to be sufficiently large. In use, trends in the peak value spectrum over time should be considered.
The source code for this sample can be downloaded here: SpikeEnergySpectrum_Sample.zip
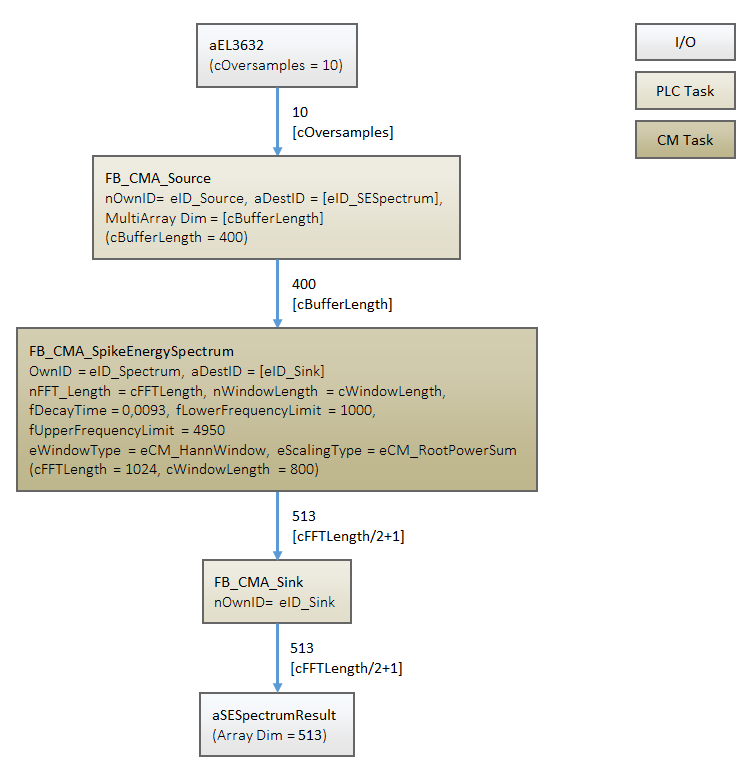
Block diagram
Program parameters
The table below shows a list of the important parameters for configuring the function blocks.
FFT-length | 1024 |
Window size | 800 |
Buffer size | 400 |
Length of the peak value spectrum | 513 |
Lower limit of the bandpass filter [Hz] | 1000 |
Cut-off frequency of the bandpass filter [Hz] | 4950 |
Explanations
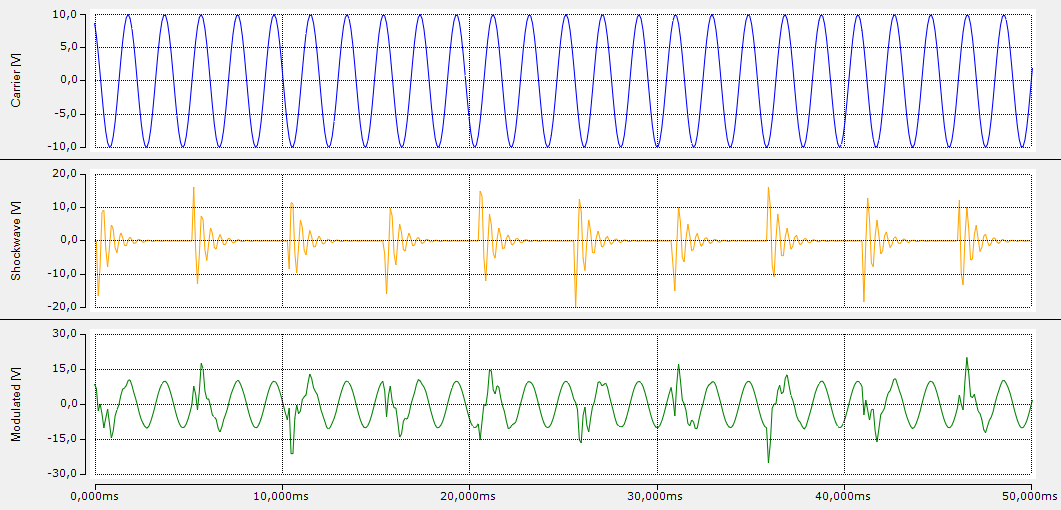
The generated amplitude-modulated input signal is composed as follows: A shock (yellow) is modulated with a frequency of 200 Hz onto a fundamental oscillation (blue). The input signal of the function block thus corresponds to the curve below (green).
The input data are processed as follows: The signal components that are not relevant for the analysis (below 1 kHz) are filtered out by means of an IIR bandpass filter. In the case of exact arithmetic, this would correspond to the shock (yellow). The filtered signal is now transformed into a time-wave form in which the energy peaks are displayed in relation to the configured decay time (fDecayTime) ("peak to peak"). The following image shows the time-wave shape for the input data described above.
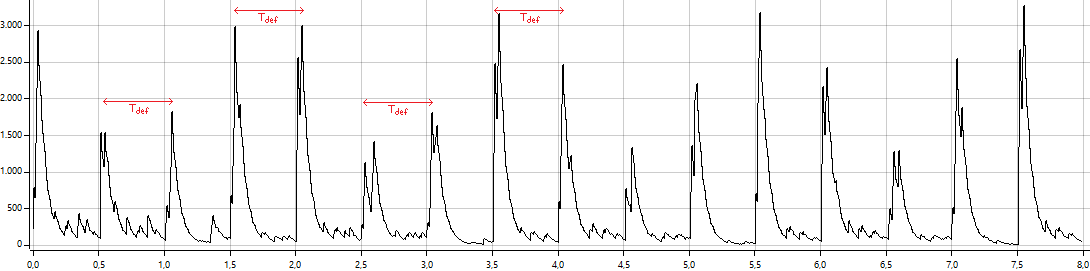
The frequency of the occurring peak values, i.e. the repetition rate of high-frequency components in the form of shocks in the original signal, is already recognizable in this representation. The distance between two consecutive peaks is 0.5 ms, i.e. 1 / 0.005 s = 200 Hz. This periodicity is represented by the calculation of a magnitude spectrum. This leads to the following visualization in the scope project of the sample:
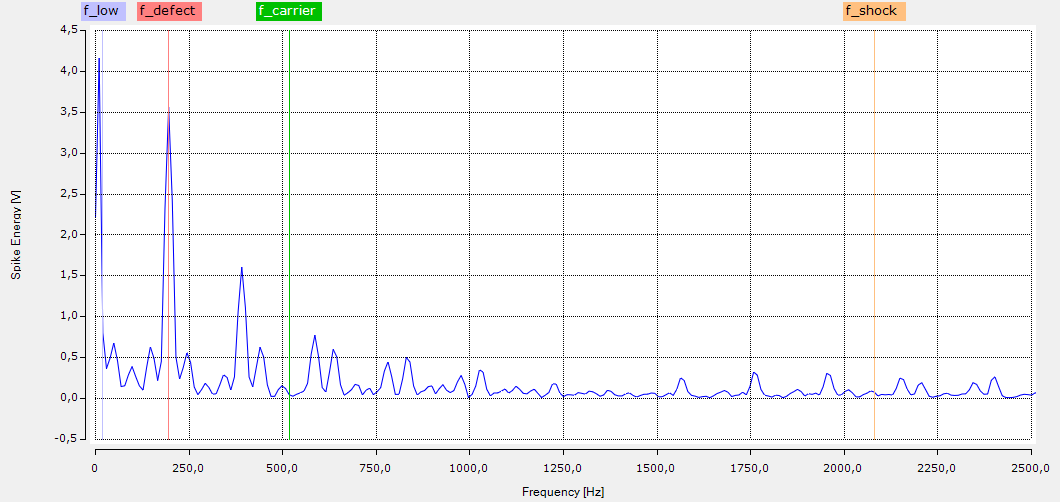
In the resulting peak value spectrum, the component of the error frequency (f_defect) at 200 Hz and the associated harmonics is clearly recognizable. Furthermore, the frequency components of the fundamental vibration (f_carrier) and those of the shocks (f_shock) are eliminated by the bandpass filtering and transformation into the time-wave form.
The peak value below f_low is not meaningful because it lies below the resolution limit of cMinFrequency = cSampleRate/cWindowLength = 12,5 Hz.
Requirements
Development environment | Target platform | PLC libraries to include |
|---|---|---|
TwinCAT v3.1.4022.25 | PC or CX (x86, x64) | Tc3_CM, Tc3_CM_Base |