Order analysis
In this sample implementation of the FB_CMA_OrderPowerSpectrum a simulated NC axis and a synthetic vibration signal are used to illustrate the parameterization of the OrderPowerSpectrum as an example and to show the difference between it and the ordinary PowerSpectrum.
The TwinCAT Solution uses a 500 μs cycle time for the NC. It is therefore preferable to use a Beckhoff IPC or Embedded PC as a target system. It is better to turn off Autostart Boot Project, especially on third-party PCs.
The code can be downloaded here: OrderPowerSpectrum.zip
Block diagram
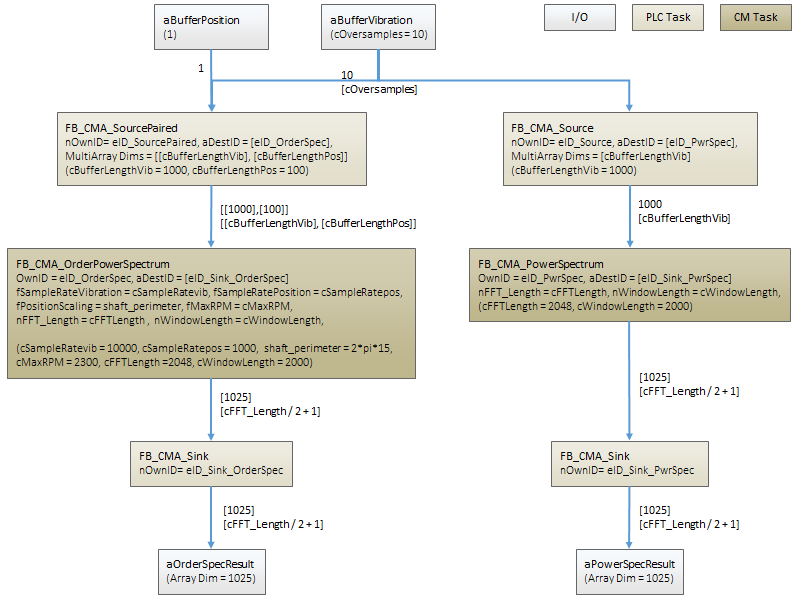
Program parameters
The table below shows a list of the important parameters for the configuration of the order spectrum, cf. GVL_constants.
The artificial vibration signal is generated in the PLC task (1 ms cycle time) with an oversampling factor of 10. This corresponds to a sampling rate of 10 kHz, cf. cSampleRateVib. The position signal is queried from the PLC task at 1 ms from the NC via the axis interface. This corresponds to a sampling rate of 1 kHz, cf. cSampleRatePos. The maximum speed of rotation is cMaxRPM.
This results in a maximally resolvable order 130.4.
The resolution of the order axis is determined by the FFT length, in this case 2048, resulting in a resolution of 0.1274. This value can be found in the sample program in the TwinCAT Scope on the symbol aOrderSpecResult under Scalefactor (i), in order to scale the representation of the array of bins to the order.
The window length of the vibration signal cWindowLength describes the signal length, which is used for transformation to the frequency range. 2000 samples have been chosen. The FFT length is to be set larger than the window length and as a power of 2. For the transformation, a Hanning window is configured with standard overlap, so that the input buffer is defined as cWindowLength/2, i.e. 1000. In the time in which the vibration buffer has 1000 elements, the position buffer contains 100 elements.
| 10000 |
| 1000 |
| 2 * PI * 15 |
| 2048 |
| 2000 |
| 1000 |
| 100 |
| 2300 |
Configuration
The source function block is only called if the speed of the shaft lies between a minimum and a maximum value. Below and above, the analysis chain is reset and there is a pause until the shaft velocity moves back into a valid range.
IF ABS(motorspeed) >= cMinRPM / 60 AND ABS(motorspeed) <= cMaxRPM / 60 THEN
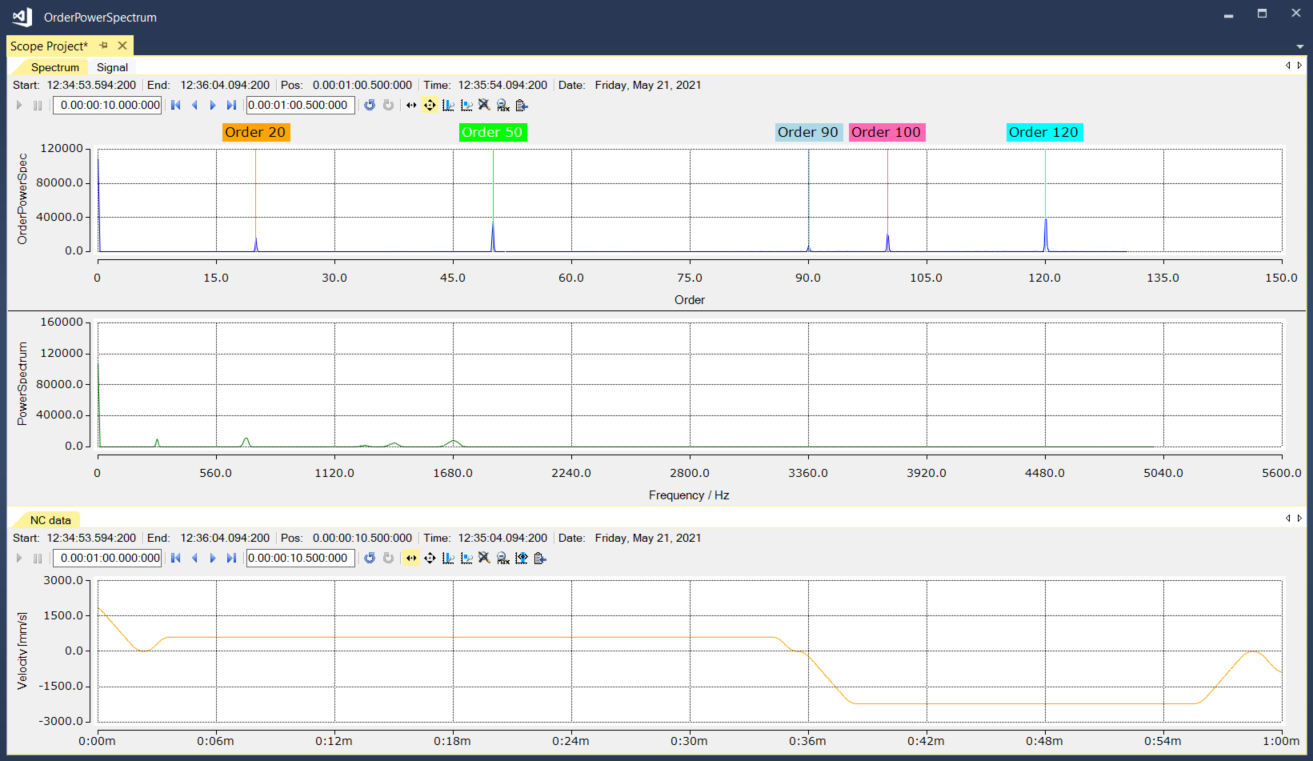
A synthetic signal is generated, which has a defined amplitude at defined orders. The orders from the array are displayed in the scope with markers for orientation.
The virtual axis automatically changes its speed of rotation, cf. nmovestate in the MAIN (PRG). In the TwinCAT Scope, the results of the OrderPowerSpectrum and the ordinary PowerSpectrum are shown on top of each other. Below that the time curve of the speed of rotation is plotted for orientation. As shown in the graph below, the synthetically generated amplitudes are seen precisely at the intended orders (cf. MAIN. Orders) in the order spectrum as sharp peaks. In the PowerSpectrum, the amplitudes can only be recognized as fuzzy peaks depending on the speed of rotation of the shaft at a different frequency and in the range of changing speed.
Requirements
Development environment | Target platform | PLC libraries to include |
|---|---|---|
TwinCAT v3.1.4022.25 | PC or CX (x86, x64) | Tc3_CM, Tc3_CM_Base, Tc3_MultiArray |