Statistical methods in windows
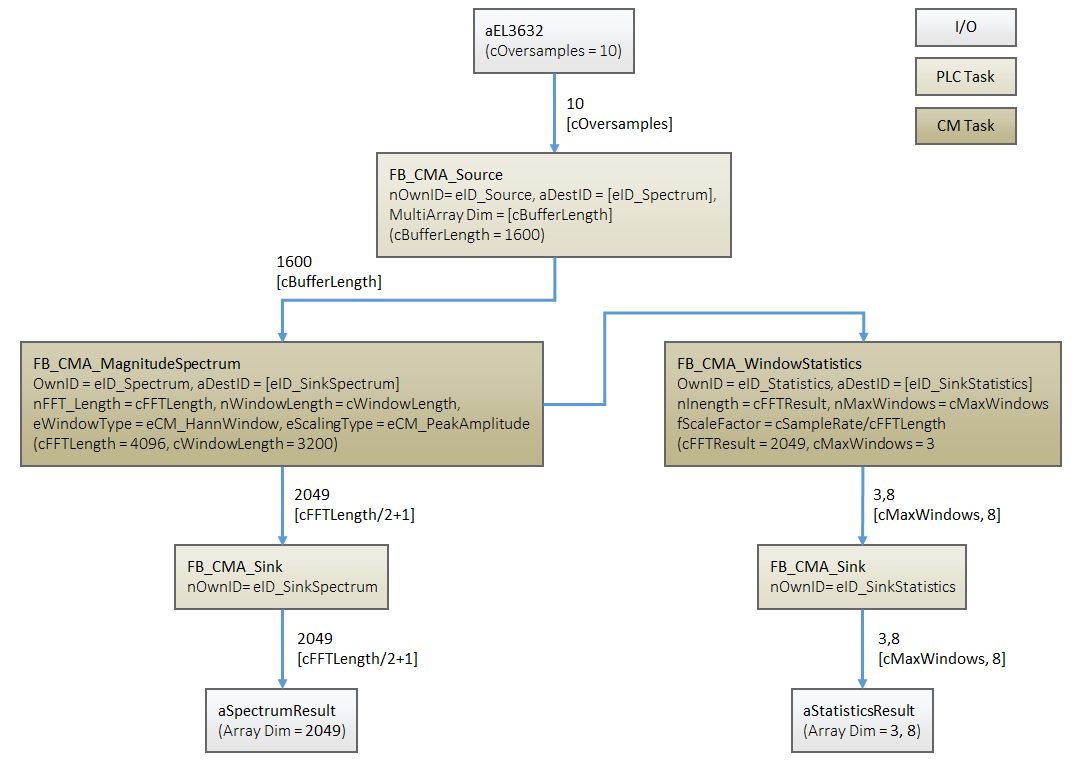
This example shows how the condition monitoring library can be used based on the FB_CMA_WindowStatistics module. Basic statistical values such as the maximum, minimum, and mean values are calculated for user-defined windows of an input data set.
The source code for the example can be downloaded here: WindowStatistics_Sample.zip
Block diagram
Program parameters
The table below shows a list of important parameters for configuring the function blocks used.
Sampling rate | 10000 |
Buffer length | 1600 |
FFT length | 4096 |
Input data size | 2049 |
Scaling factor | 10000 / 4096 |
Number of windows | 3 |
Explanations
In this example, a spectrum is calculated first and is then monitored in more detail in the relevant areas. These areas are located at the peaks of the spectrum at 100, 1180, 2260 Hz and each area has a width of 200 Hz.
The scope project included in the example visualizes the calculated spectrum and the defined windows for the statistical calculations. A digital chart shows these values on the window around the frequency 100 Hz.
Requirements
Development environment | Target platform | PLC libraries to include |
|---|---|---|
TwinCAT v3.1.4022.25 | PC or CX (x86, x64) | Tc3_CM, Tc3_CM_Base, Tc3_MultiArray |