Manager ("Recorder")
The Analytics Storage Provider Recorder is part of the Analytics Engineering setups. Therefore, you can find the recorder in the installation of the TwinCAT Analytics Workbench and the TwinCAT Analytics Service Tool.
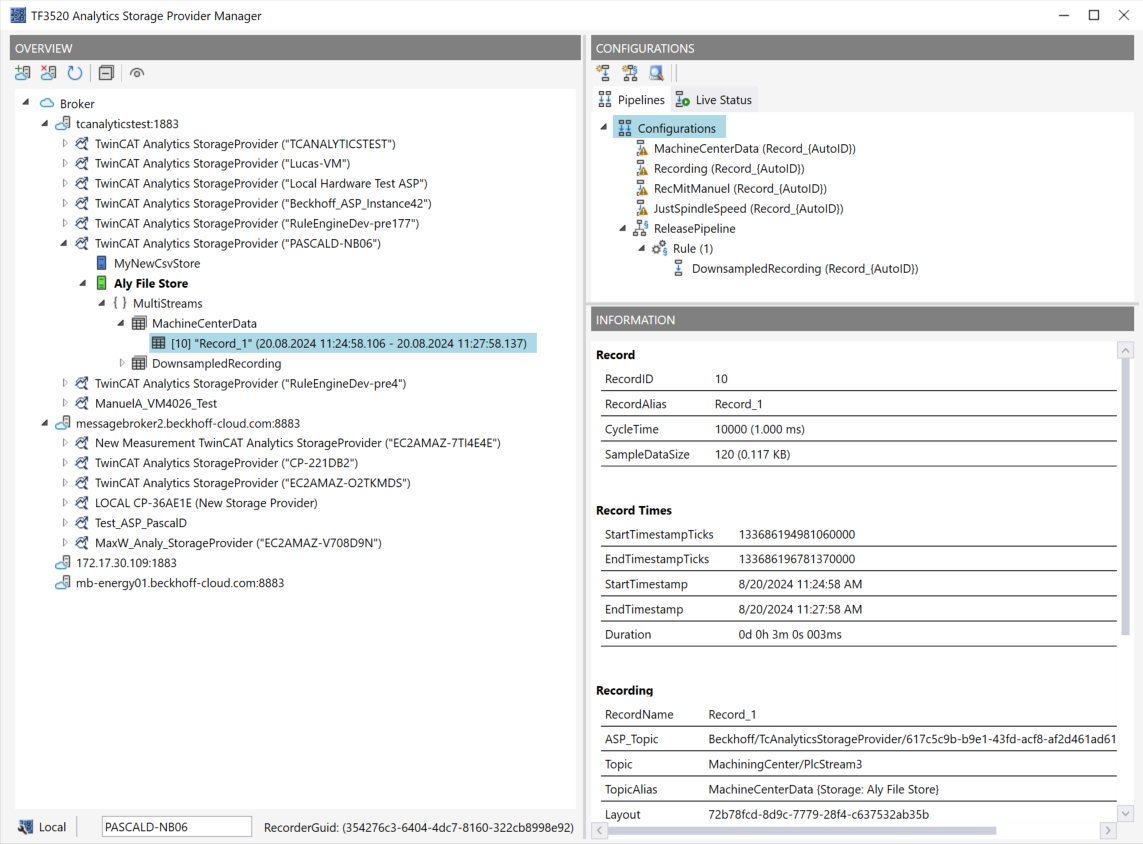
With the Storage Provider Recorder, recording definitions can be created, started, and managed. In addition, it is possible to manage the data memory of individual Analytics Storage Providers. All important properties of the found Analytics Storage Providers, as well as the historical data, are clearly displayed.
Toolbar Manager window (“OVERVIEW”)
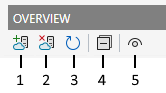
1 | Add new broker |
2 | Remove selected broker |
3 | Refresh display |
4 | Collapse all nodes |
5 | Switching between dark and light modes |
Function Manager window (“OVERVIEW”)
Assign a “RecorderAlias” first. This helps group the started recordings and find the recordings you started yourself again.
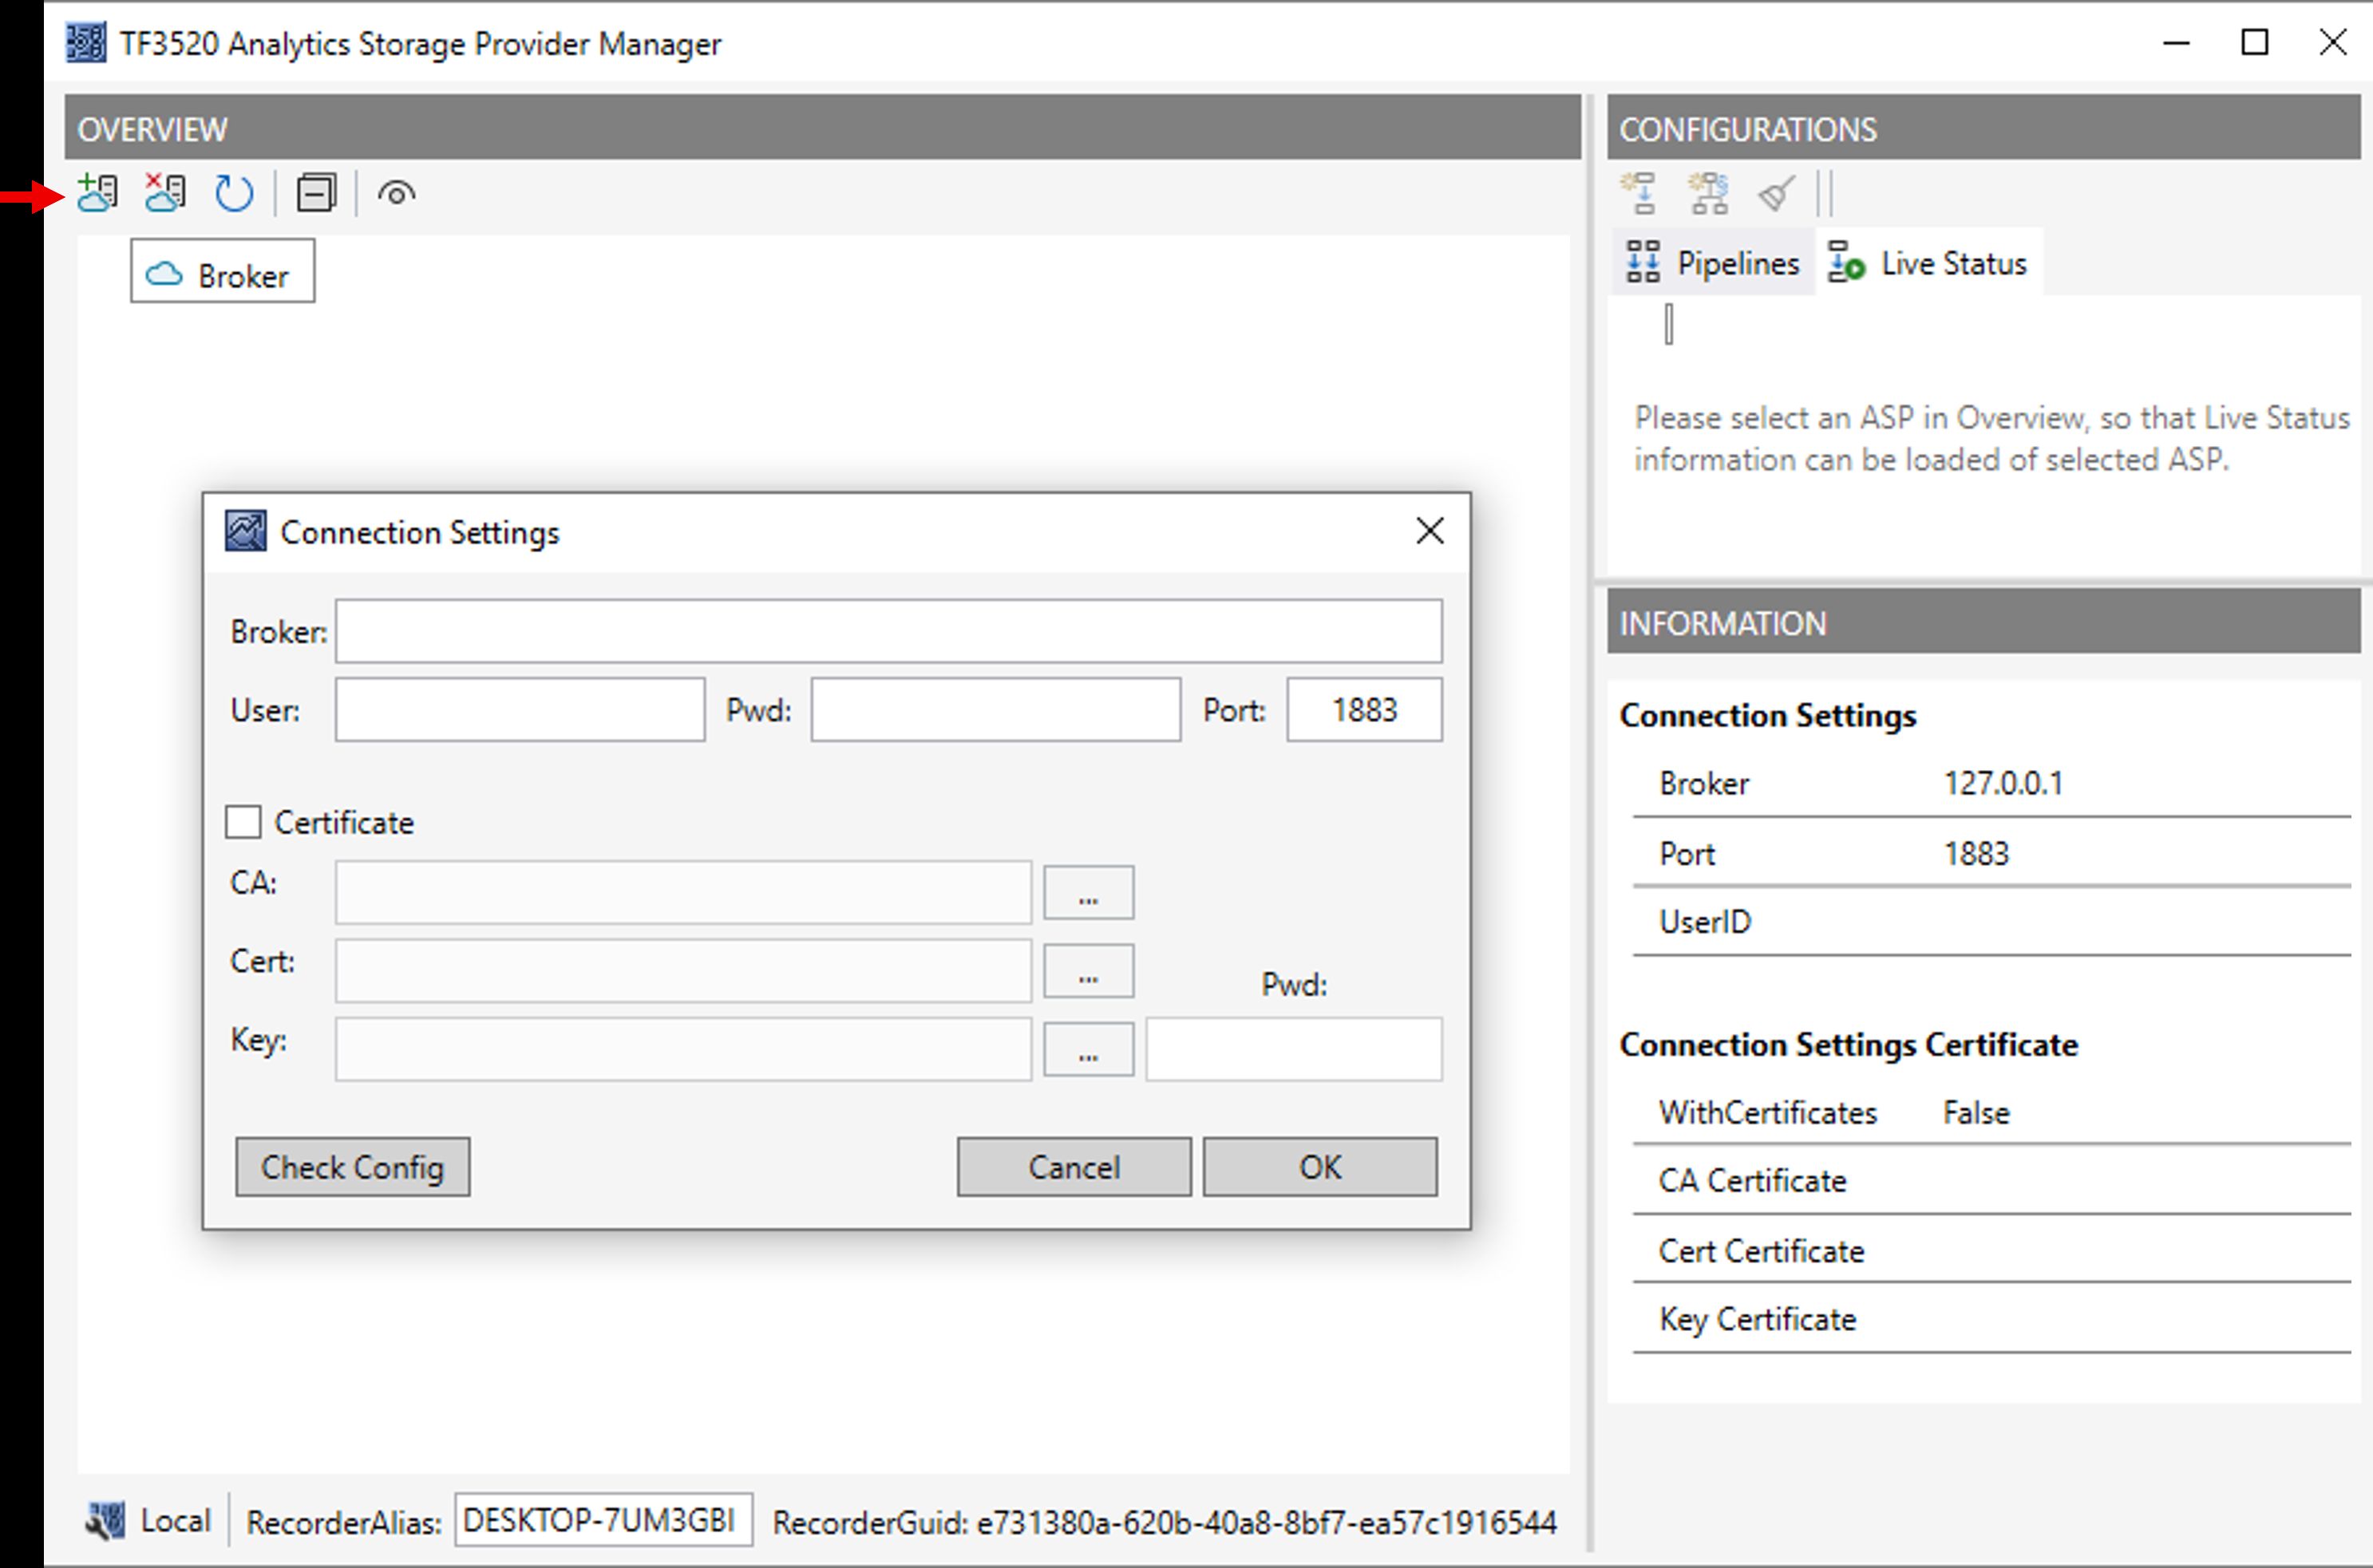
After that, one or more brokers can be set up. This is accomplished using the familiar input mask for MQTT connection properties.
After establishing a connection to the broker, all Analytics Storage Providers connected to it will be listed.
“Storage” status
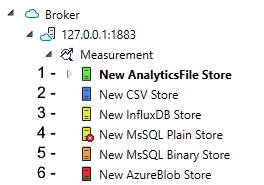
1 | Storage online |
2 | Storage offline |
3 | Storage starting |
4 | Storage starts with an error. Still trying to start it. |
5 | Storage is shutting down |
6 | Storage is in the error state. |
Toolbar Manager window (“CONFIGURATIONS”)
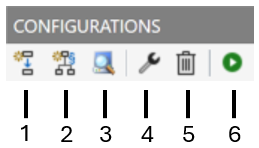
1 | Create a new pipeline. |
2 | Create a new pipeline with Rule Engine. |
3 | Open Target Browser for connecting simple pipelines. |
4 | Edit a selected pipeline. |
5 | Delete a selected pipeline. |
6 | Start a selected pipeline. |
Function Manager window (“CONFIGURATIONS”)
The window is divided into two tabs. Pipelines and Live Status. Under Pipelines, you will find the configurations of your pipelines. From here, you can define new pipelines and edit, delete, or start existing ones.
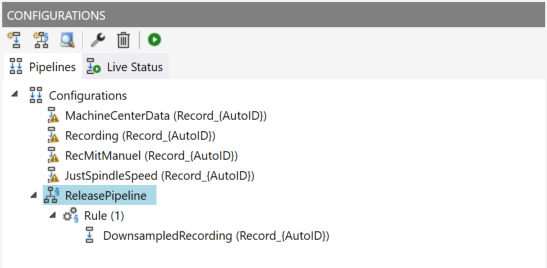
To create a new simple pipeline, click the Create new pipeline button. The following dialog opens.
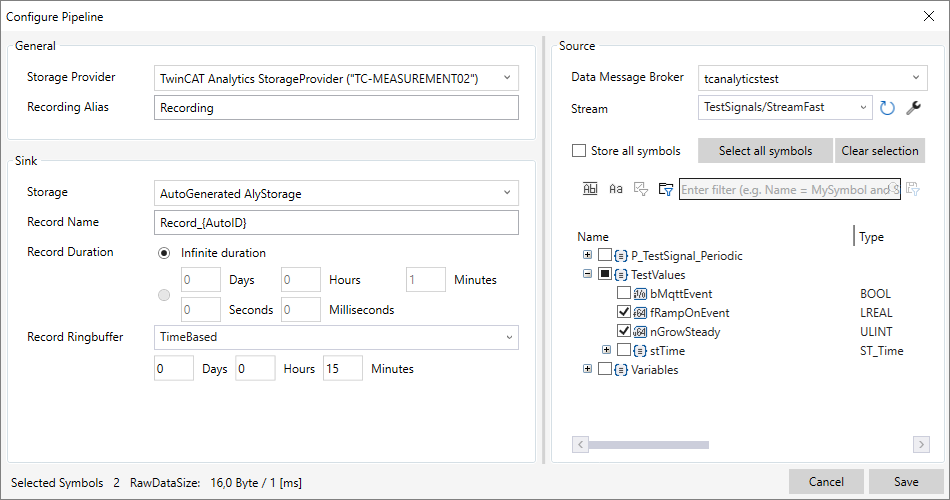
First, select the desired Storage Provider and assign a meaningful Recording Alias. You can then select the variables to be recorded in the right-hand area under Source. In the Sink area, you have the option of defining settings for data storage. Here you can select the desired Storage and the Record Name. Various placeholders are available for the Record Name, which you can use as required:
"{AutoID}" | Automatically incrementing index |
"{Topic}" | Topic of the stream to be recorded. |
"{SystemID}" | System ID of the stream to be recorded. |
"{Layout}" | Layout of the stream to be recorded. |
"{CycleTime}" | Cycle time of the stream to be recorded. |
"{SampleSize}" | Data size of a single sample in bytes. |
"{RecordStart}" | Start time of the recording |
You can use Record Duration to set the recording duration. Otherwise, the recording will continue indefinitely until it is stopped manually. In addition, you can define a ring buffer for recording in the Record Ring buffer area. The buffer size can be specified based on a time interval or a memory size. The latter mode is not available for all storage types.
The entries are confirmed with Save and a new local recording definition is created. If you have already saved the configuration, you can save a copy using the context menu of the Save button Save as Copy .
It is now possible to start this definition directly via the toolbar or the context menu.
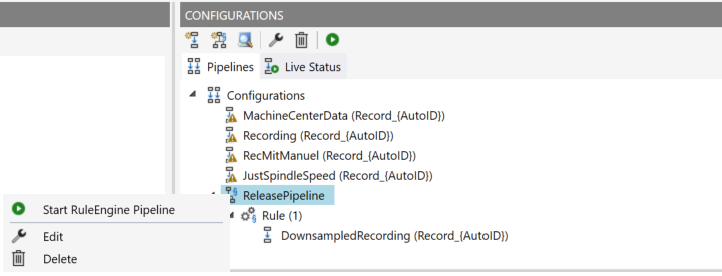
The definition can also be made globally accessible. This is done via the context menu using the Publish Pipeline option.
The following dialog will open:
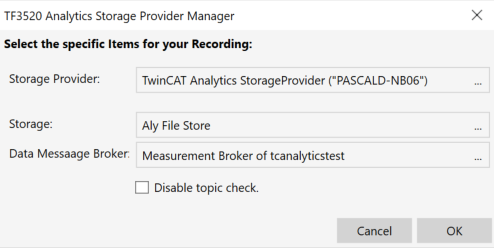
You can now select the desired Analytics Storage Provider through which the definition will be published. In addition, the definition is assigned a Storage and a Data Broker of the selected Analytics Storage Provider. After the selection, the recording definition is confirmed with OK and published to the selected Analytics Storage Provider. This way, any Storage Provider Manager connected to the MQTT Broker can find it.
Once a pipeline has been started, the view automatically switches to the second tab, Live Status.
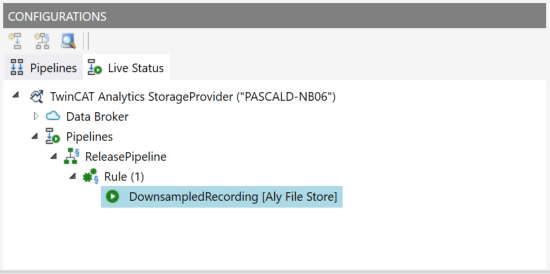
All active pipelines from all users are listed here. You can stop the pipelines in this tab, and you can also jump to the resulting record.
Furthermore, a download function is available in the Manager to download data to your local engineering. Select the corresponding record and start the download via the context menu. Regardless of the store in which the data is stored, it is always saved as an Analytics File on the local engineering system.
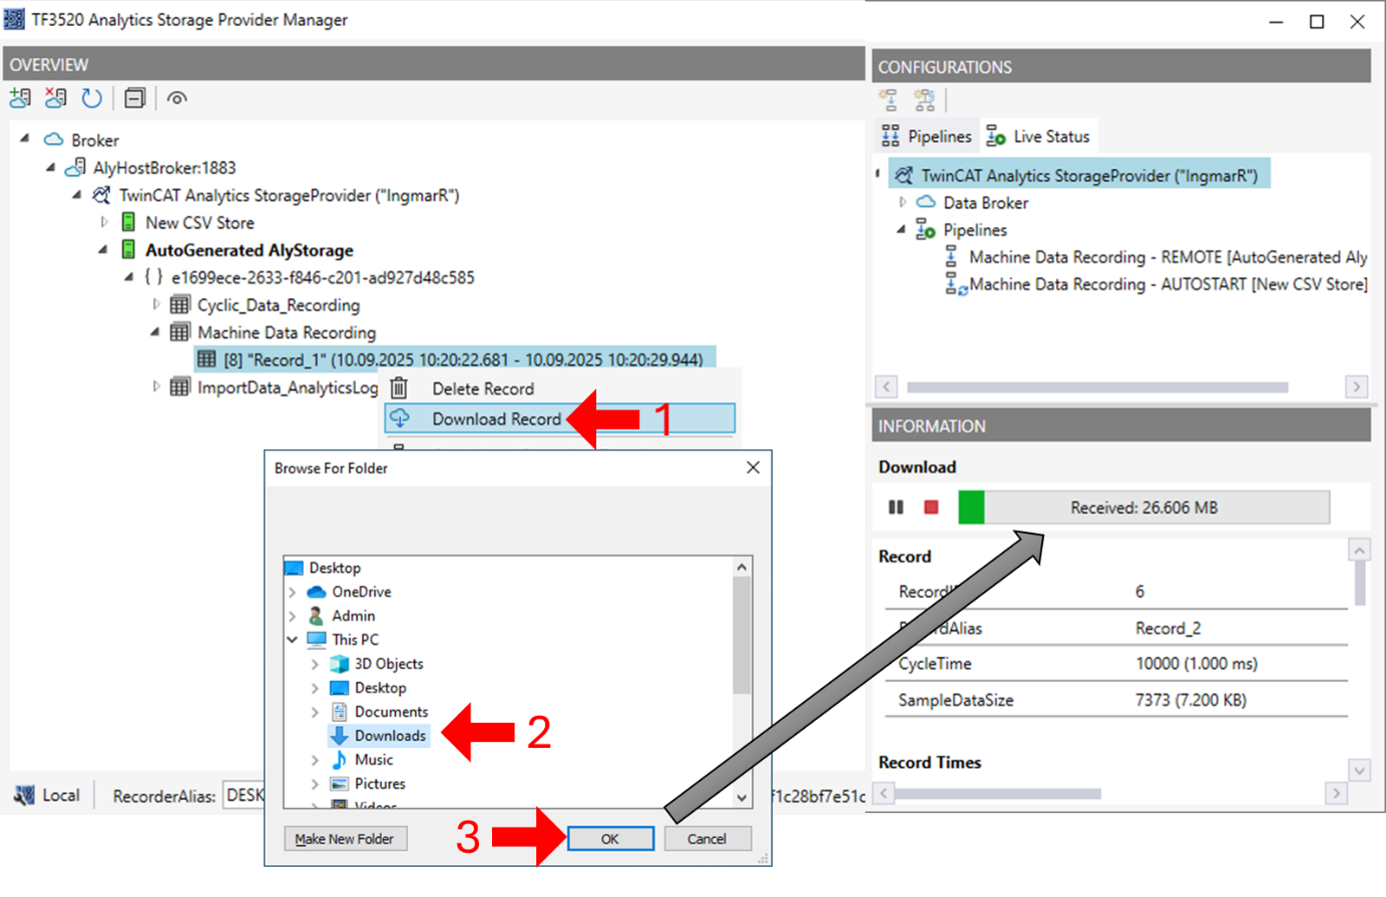
In combination with the data import function in the Storage Configurator, the Analytics File also serves as a practical exchange format. Both functions can be used to move data from a CSV file to an InfluxDB2, for example, or from a Microsoft SQL® to a CSV file, etc.
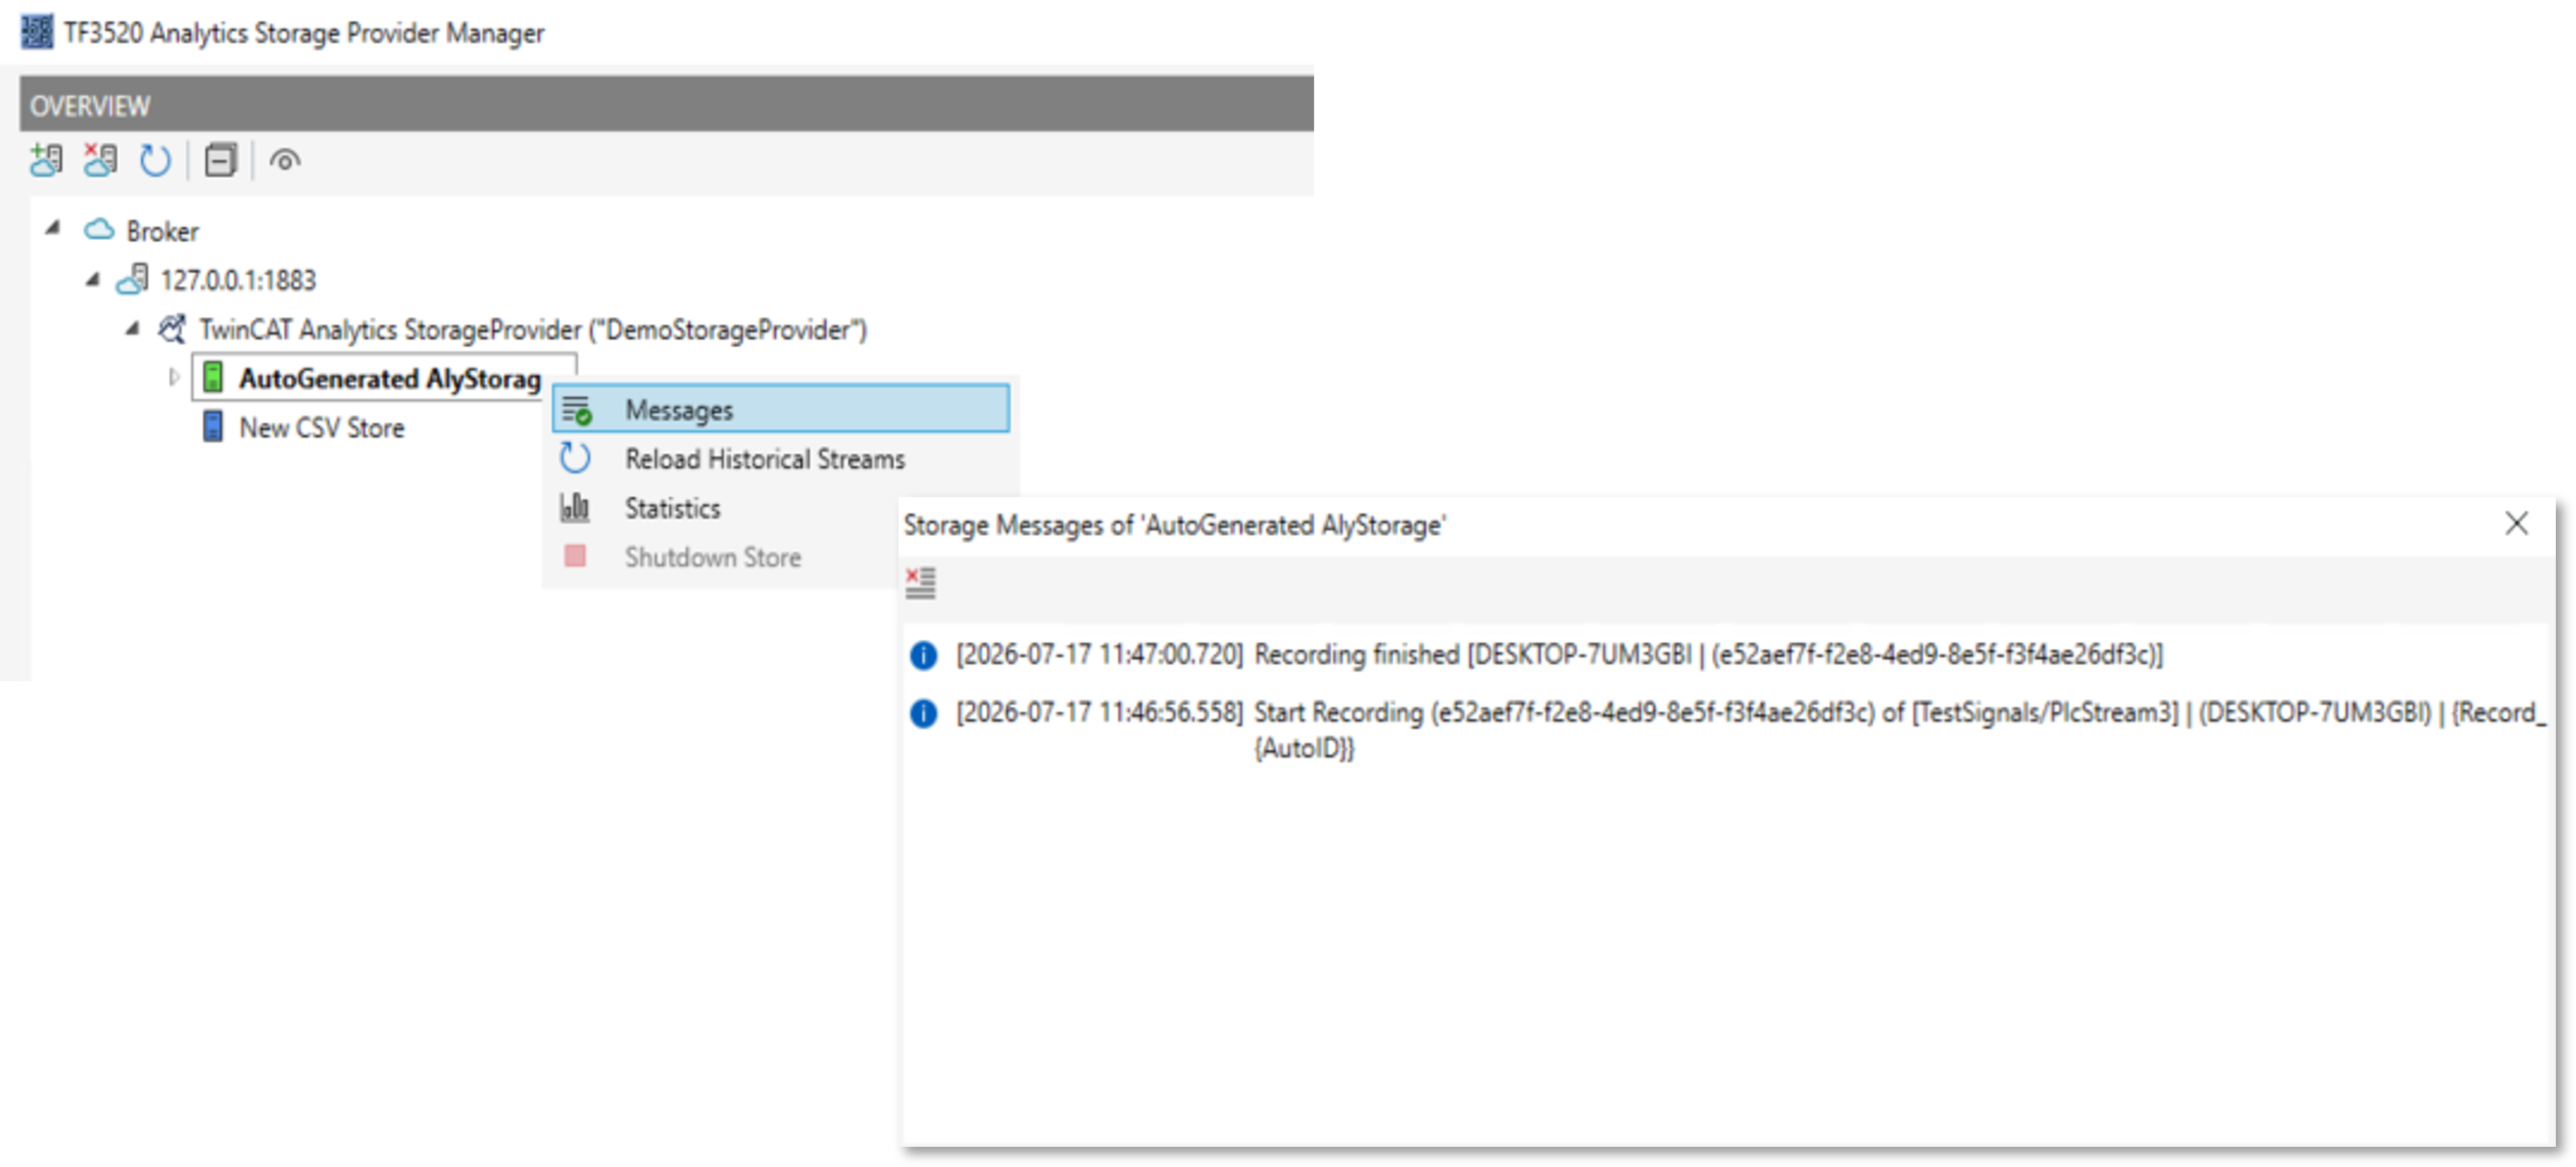
Viewing Storage Provider messages
The Storage Provider delivers messages via MQTT. To view these, right-click on the desired Storage Provider and select “Messages” to open the Messages window.
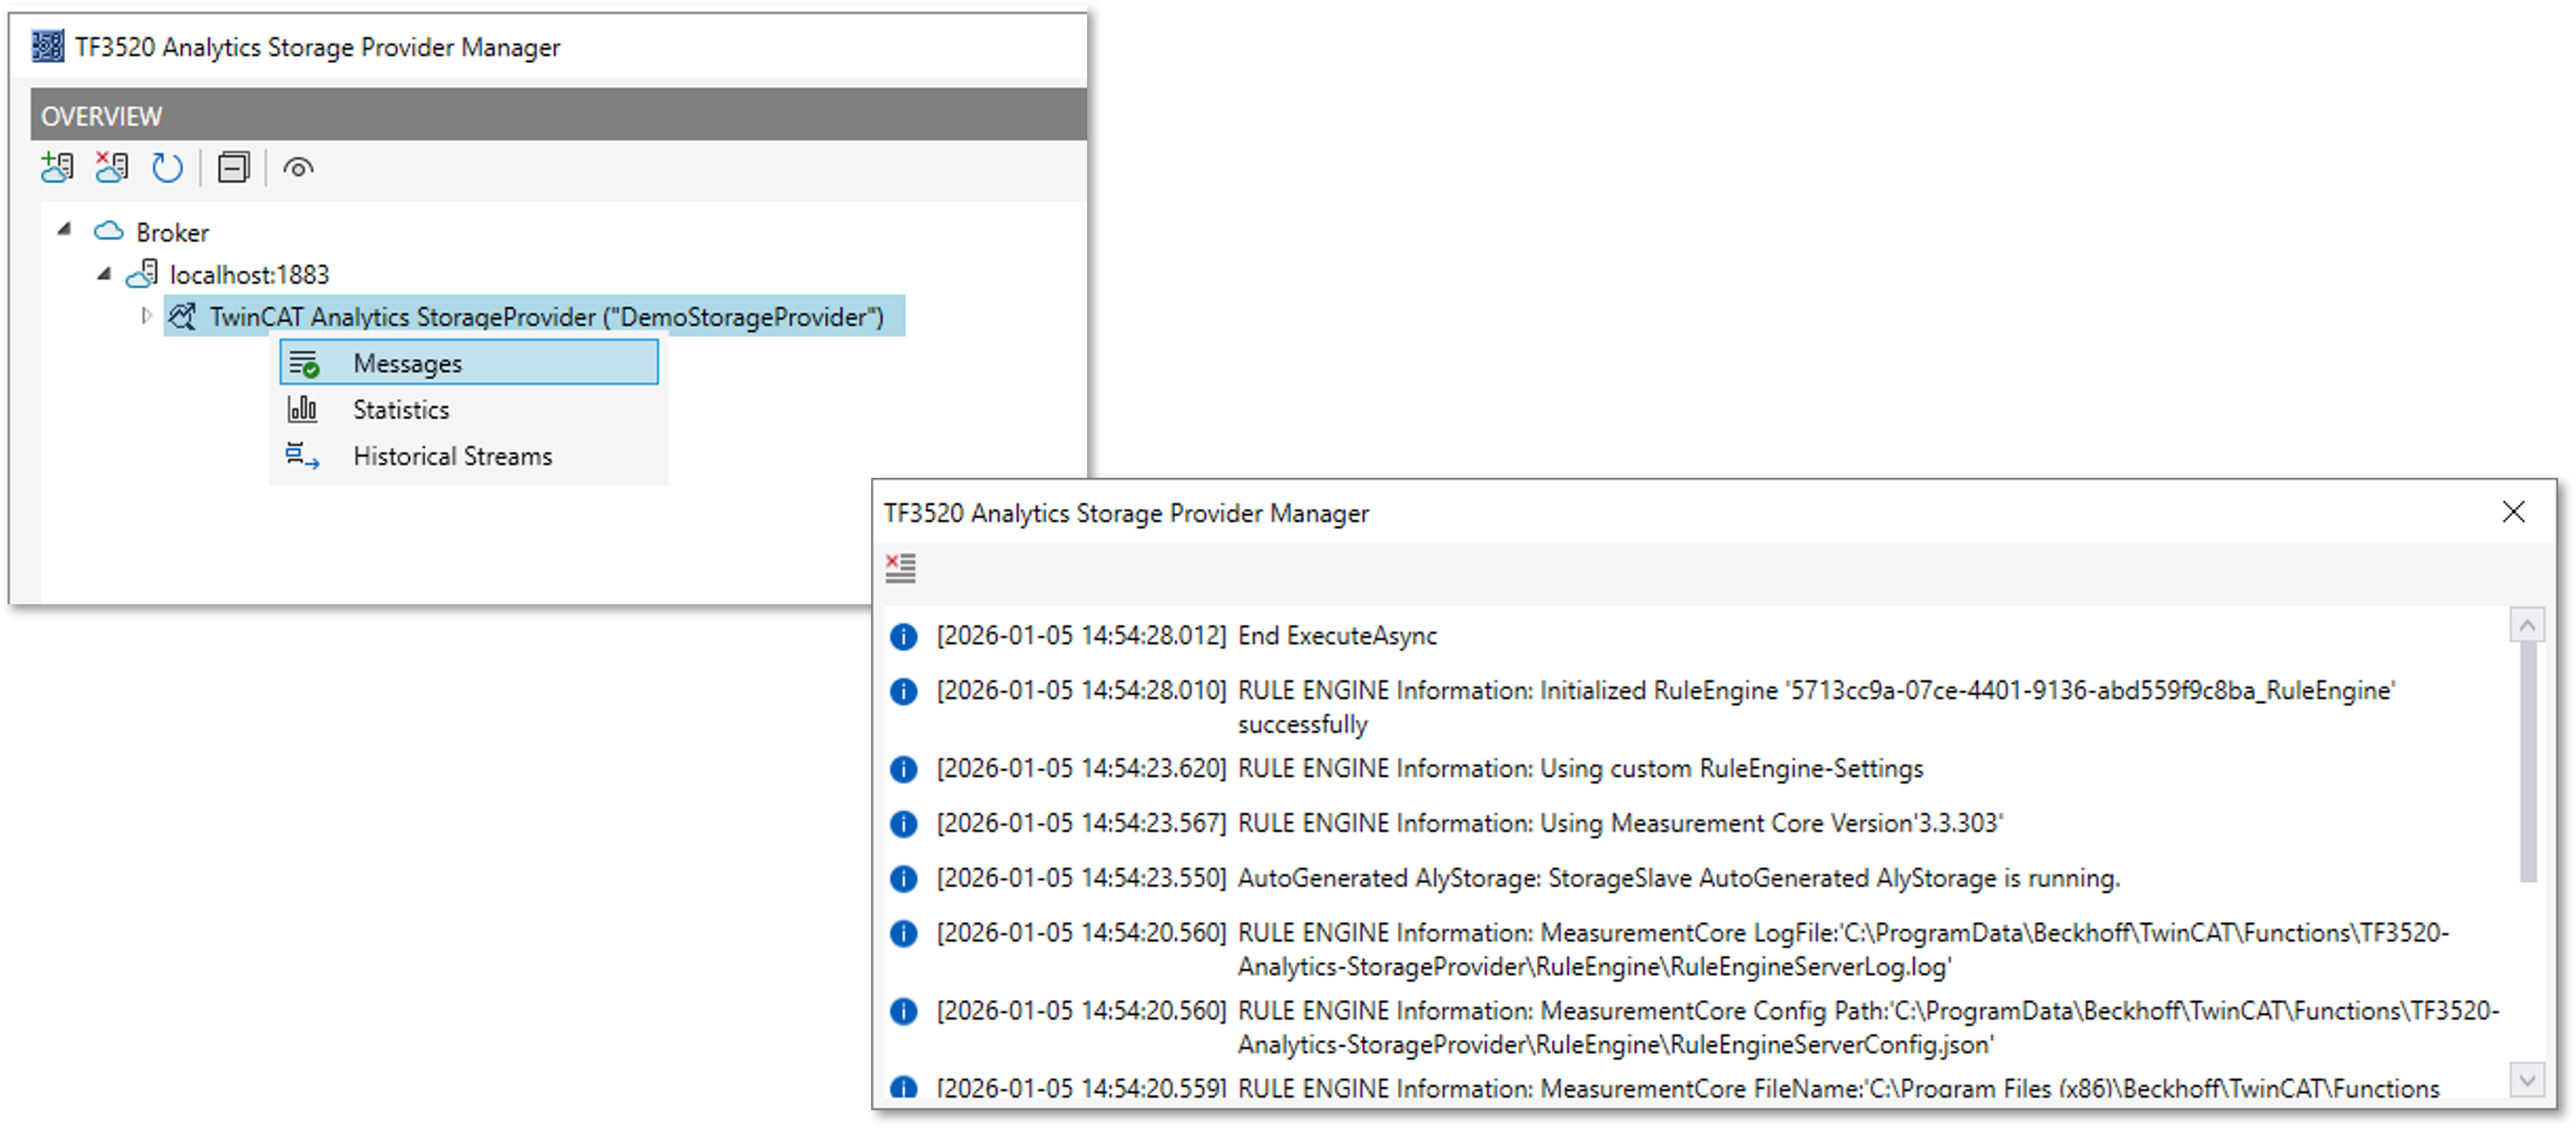
Viewing storage-specific messages
Each storage system also provides specific messages. To view these, you can also open the Messages window by right-clicking on the desired storage and selecting “Messages”.
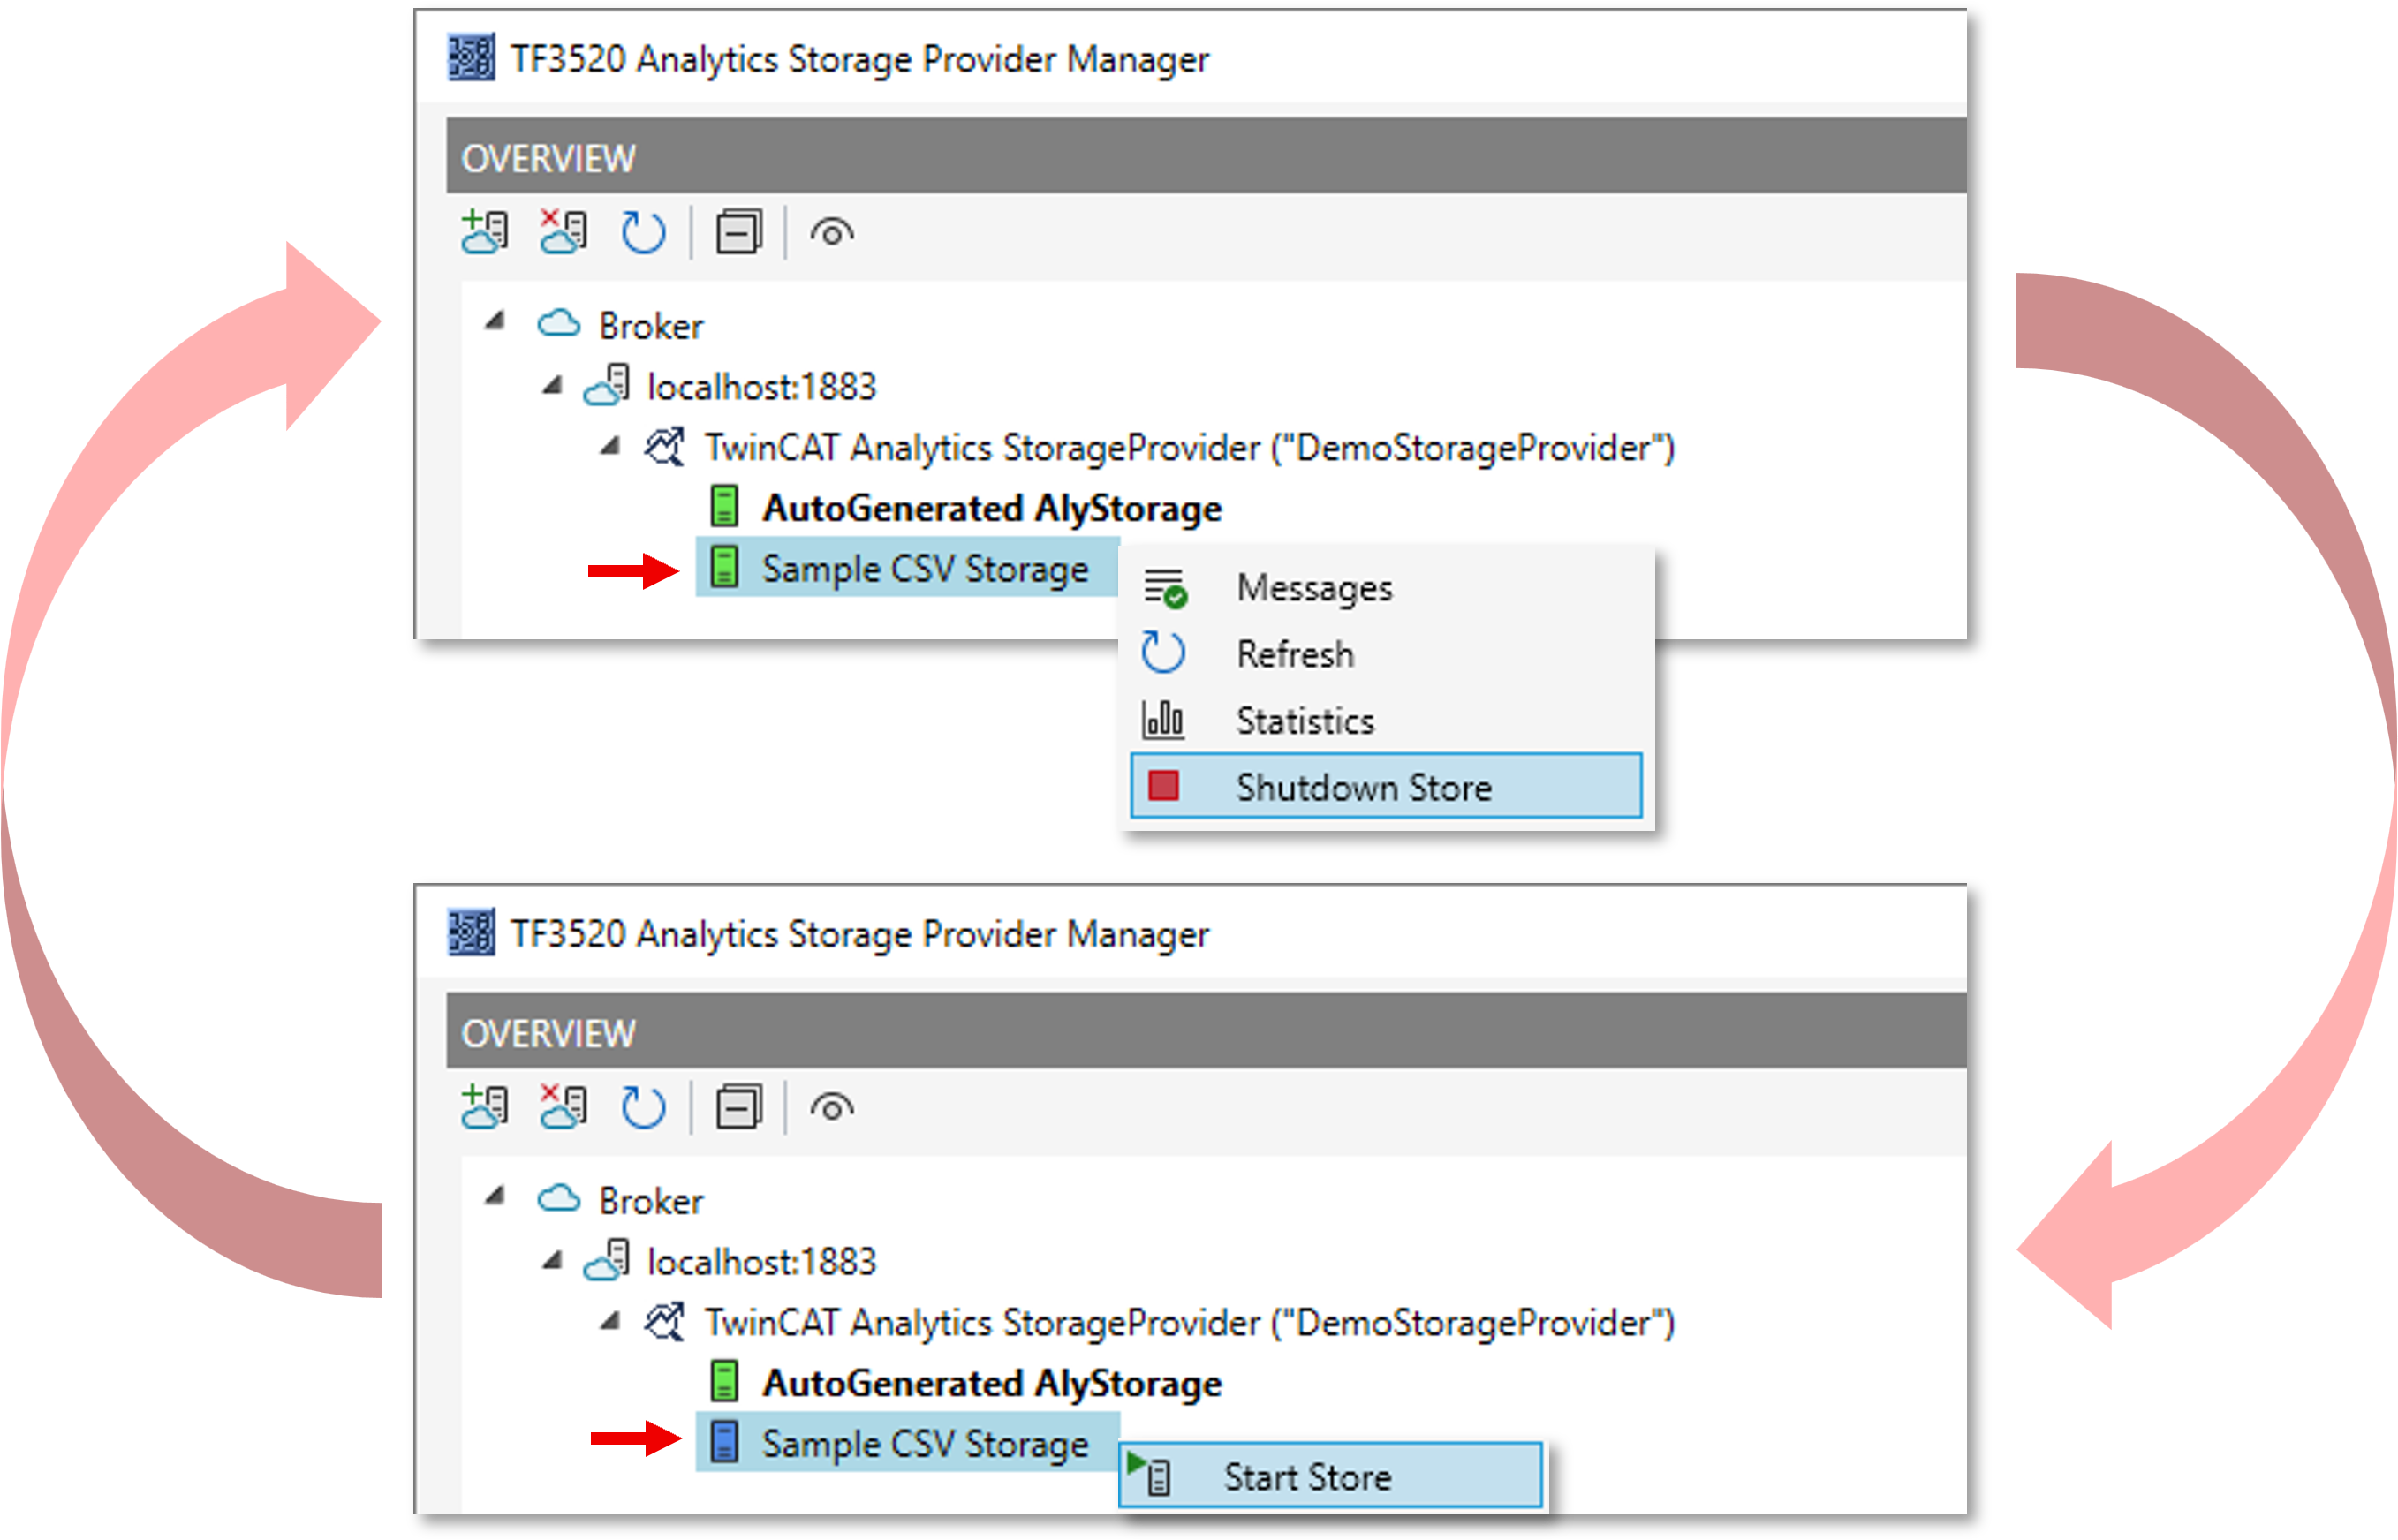
Starting and stopping storage systems
You can start and stop the respective storage instance by right-clicking. The default storage defined in the Configurator remains active at all times and is therefore exempt from this rule.
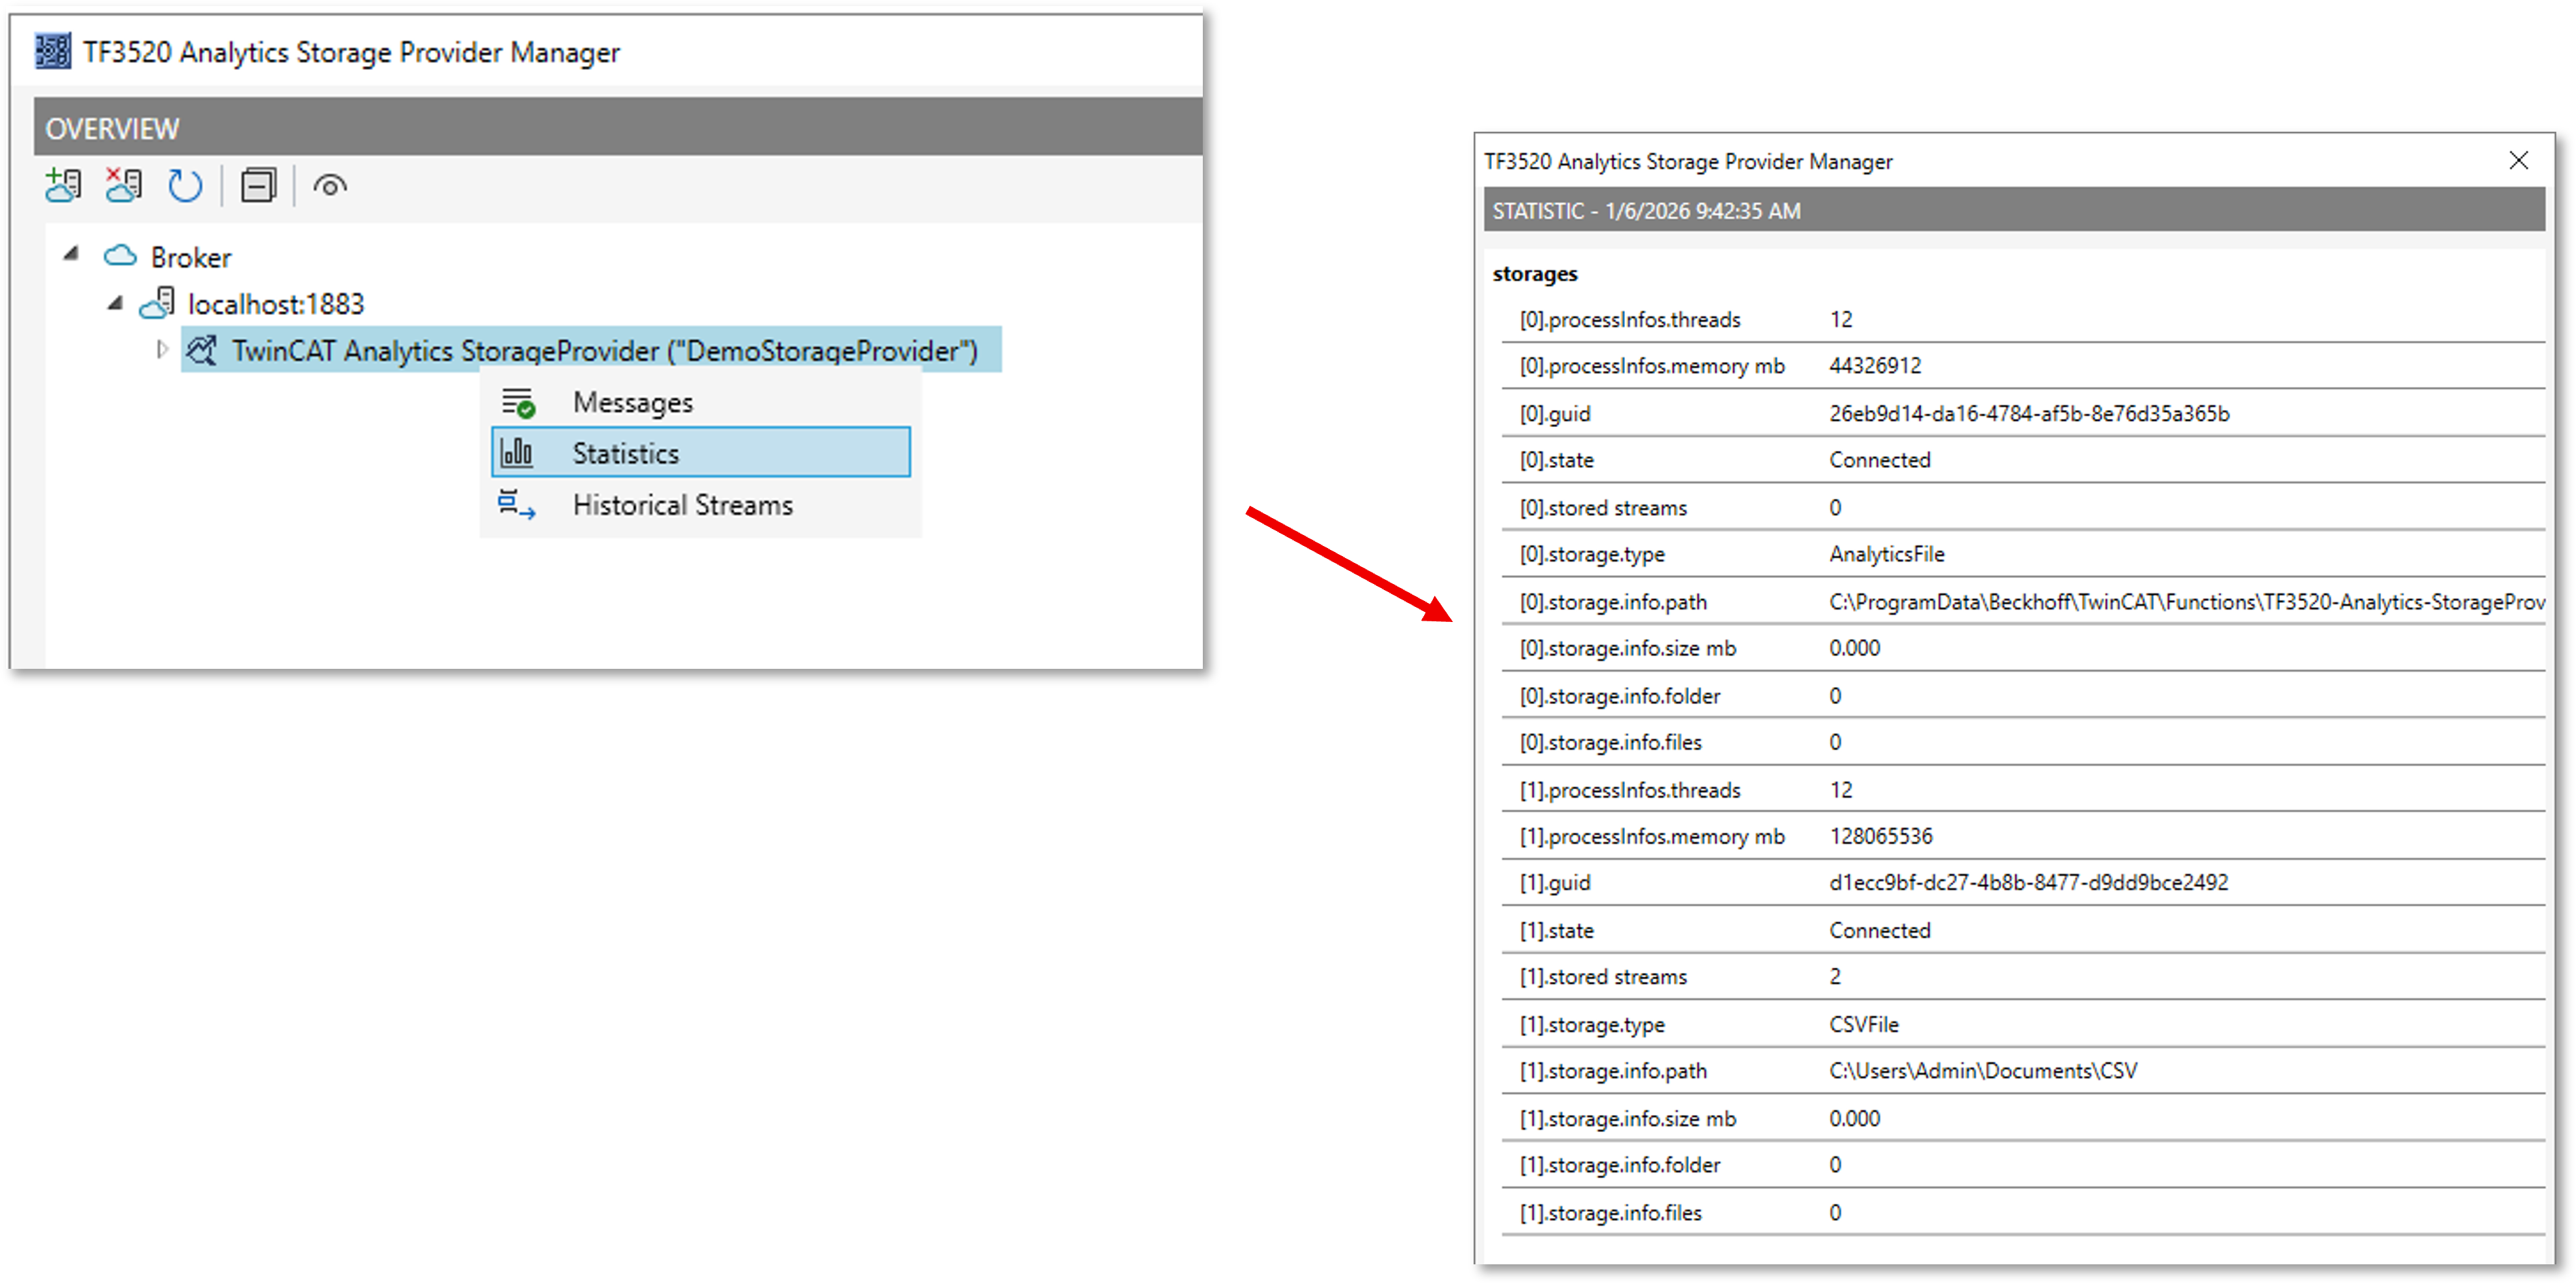
Viewing statistics
In addition to the messages, the Storage Provider also provides some statistics. You can view these by right-clicking on the desired Storage Provider and selecting “Statistics”.
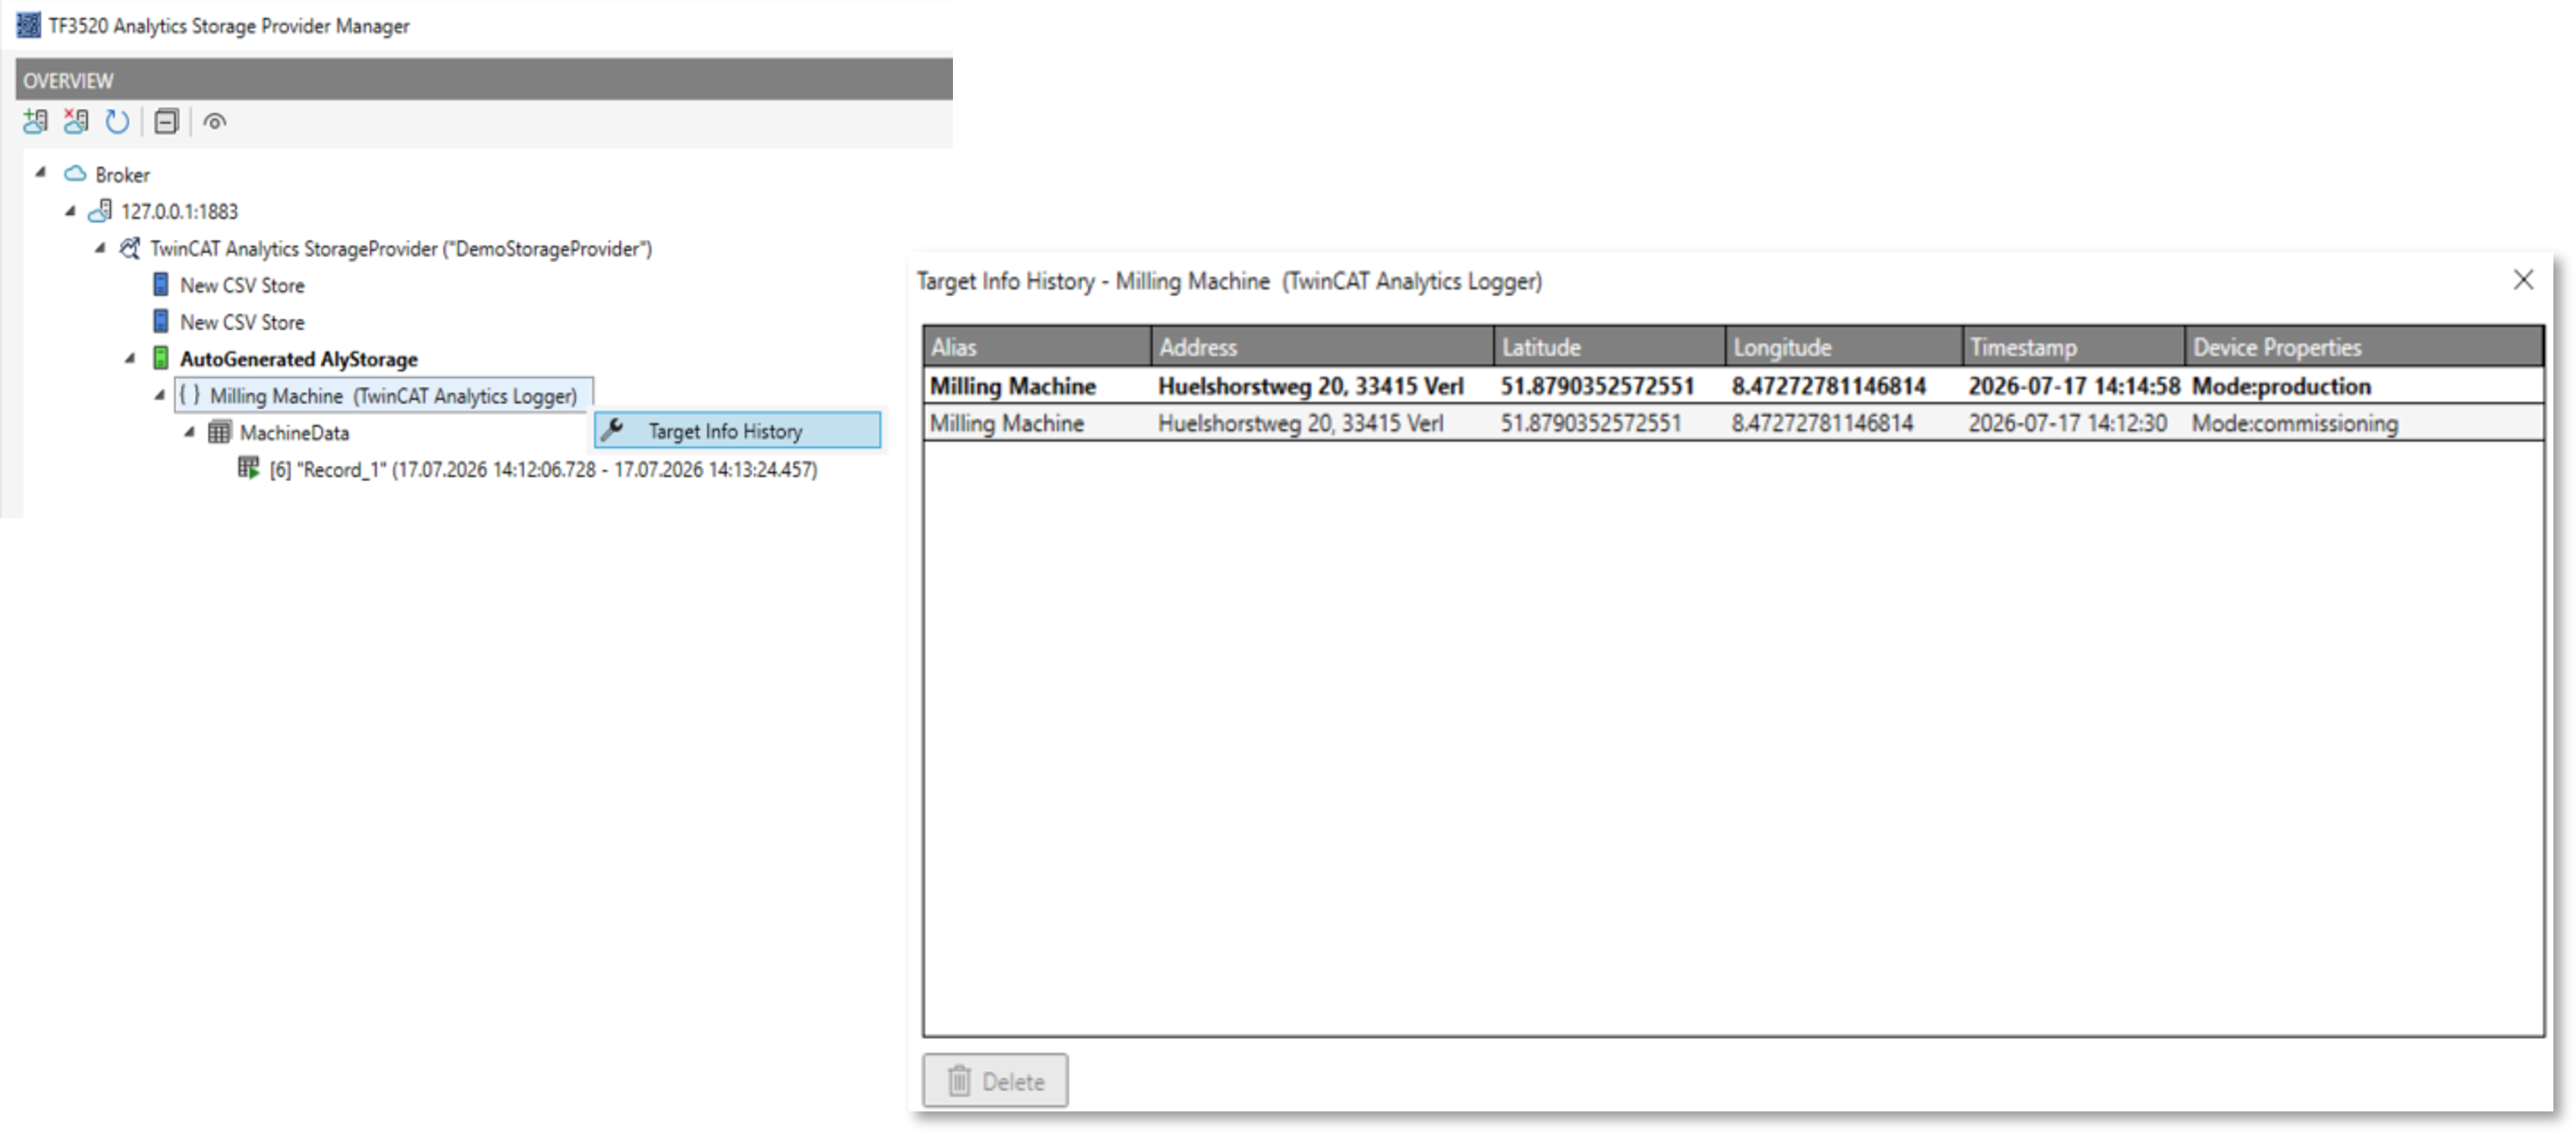
Viewing the history of target information
Starting with version 33.17.0, the Storage Provider also stores the history of the information provided by the target, such as system aliases and localizations. This information can be accessed by right-clicking -> Target Info History.
Managing recordings and records
The stored data (recordings and records) is displayed below a storage location. You can delete the selected object by right-clicking it. However, this is only possible if the relevant records are complete – that is, no more data is being recorded. The current state of a record is indicated by the icon.
| The record is complete and contains data |
| The record has started, but no data has been written yet |
| The record is currently active, and data is being written |
| The record is in the error state |
| The record is currently being deleted |
| The record is being downloaded |


Adjusting ring buffers in live status
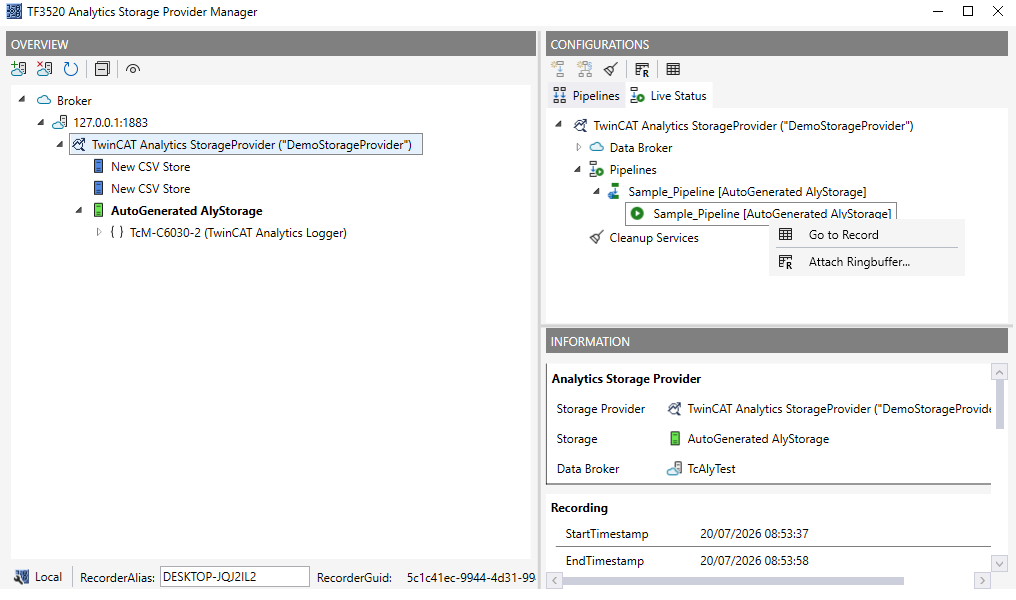
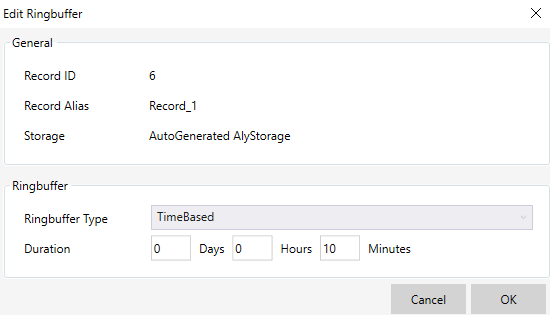
Starting with version 33.17.0, a pipeline’s ring buffer can also be modified at runtime. For example, a ring buffer can be added to a running pipeline at a later time. To do this, right-click on the pipeline and select Attach Ringbuffer. You can then configure the ring buffer.
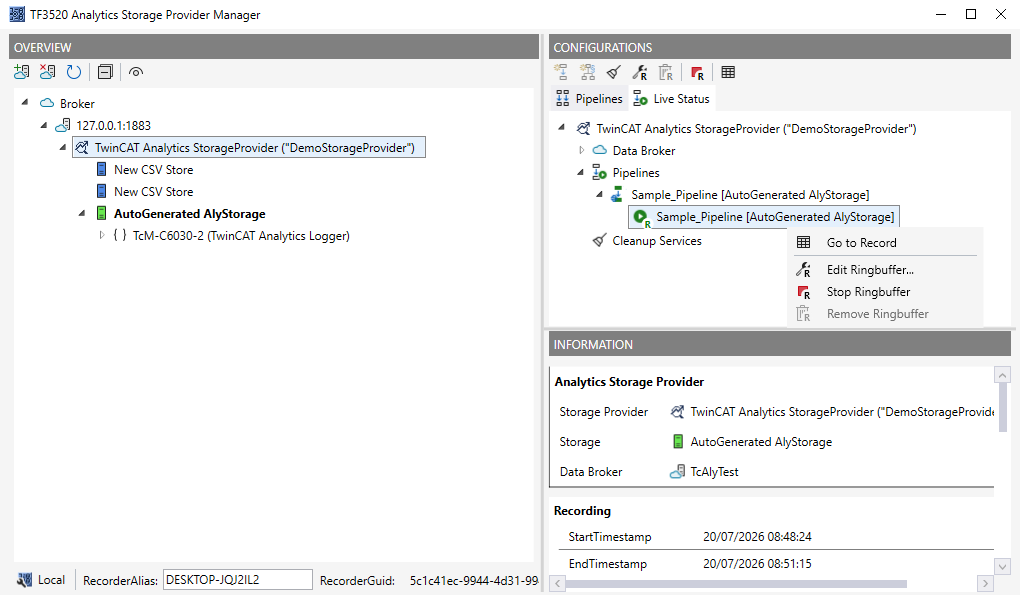
In addition, the ring buffer can be started and stopped separately from the pipeline. The status icon next to the pipeline indicates whether the ring buffer is running or stopped.
Configuring cleanup services in live status
Starting with version 33.17.0, cleanup services can also be configured in Live Status. These also feature a ring buffer function. Unlike the well-known record ring buffer, however, the cleanup service operates at the recording level rather than the record level. The cleanup service first considers all records that belong to a recording. This means that, if necessary, even completed or stopped records may be deleted or overwritten.
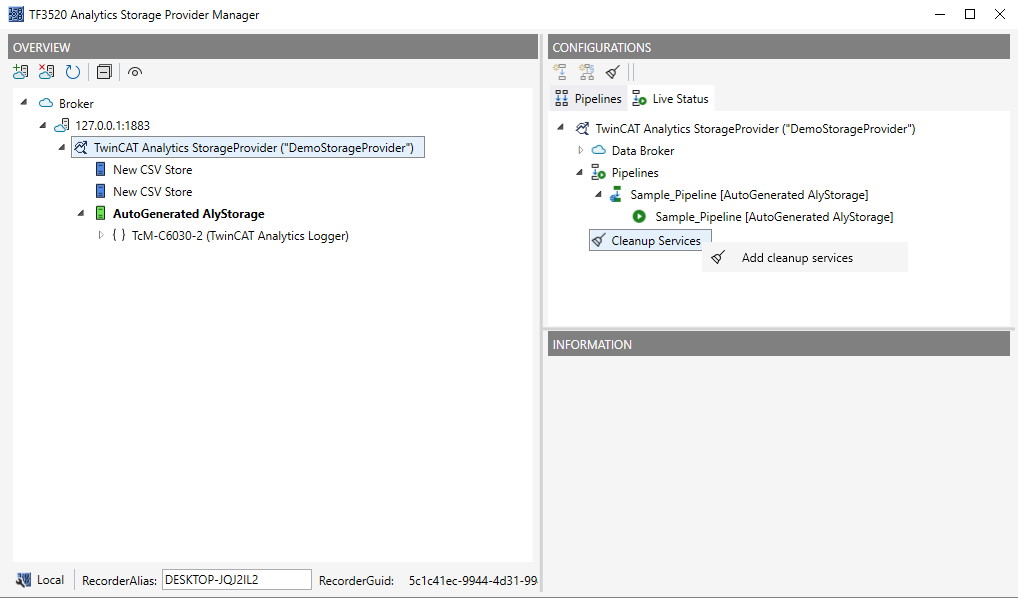
To add a new cleanup service, right-click “Cleanup Services” and click “Add” to create a new cleanup service. The corresponding configuration screen will then open.
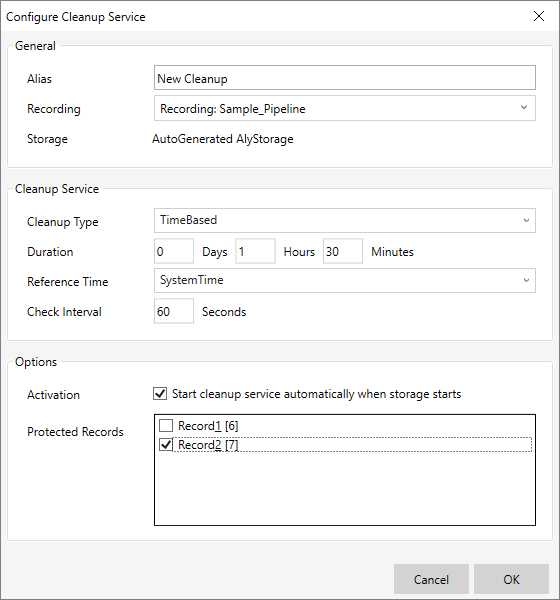
You can configure the following parameters:
Alias | Display name for the cleanup service |
Recording | Recording to which the cleanup service should apply |
Cleanup Type | Cleanup Type
|
Duration/Size | Size of the ring buffer |
Reference Time (only for Timebased) | Reference time for the calculation basis
DataTime is a particularly suitable option for event-based data or data with gaps. The most recently written timestamp is always used as a reference. If no new data is written over a certain period of time, the cleanup service will not overwrite any data during that time. With SystemTime, on the other hand, the current system time is always used as a reference. In this case, older data is deleted even if no new data is written. |
Check Interval | The time interval after which the cleanup service checks the data again |
Activation | If this option is enabled, the cleanup service starts automatically as soon as the associated storage is started. |
Protected Records | Selected records are excluded from the cleanup. This means that this data will not be overwritten or deleted. |
Then click OK to save your changes. The cleanup service is now displayed under the “Cleanup Services” node. You can edit, start, stop, or delete it using the context menu.
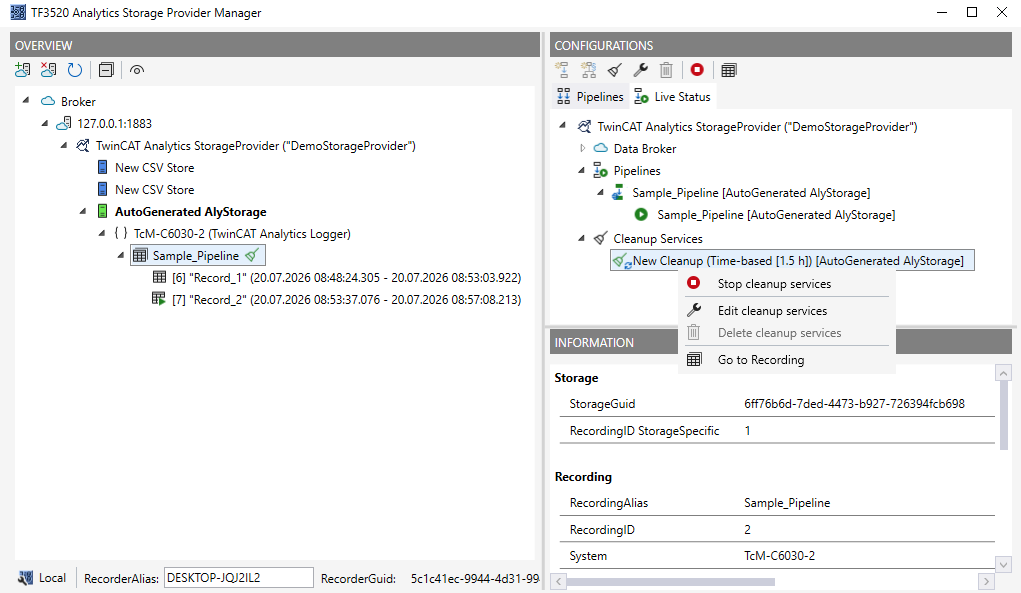
Cleanup states
| The cleanup service is currently stopped. |
| The cleanup service is currently running. |
| The cleanup service is running, but a warning has been issued. For more information, see the messages or the log files. |


