Linear Regression Fitting
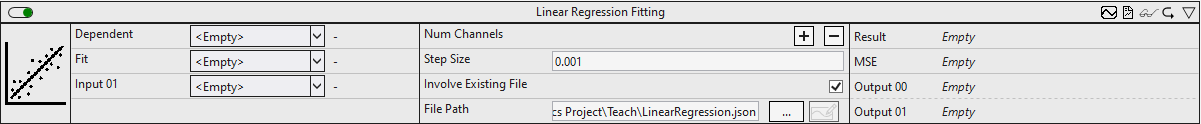
The Linear Regression Fitting function block approximates one variable (the Dependent input) by linear combination of several other variables (Input 01 ... Input 0n). This is done by the incremental stochastic gradient method. At the end of the analysis, the calculated coefficients are written to a file.
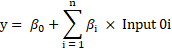
The linear combination is given by the following equation:
In each cycle, the values for  to
to  are recalculated using the following rule:

This corresponds to the minimization of the squared deviation of the calculated values y (output by the function block as result) from the corresponding input value Dependent. The parameter  corresponds to the step size and specifies how strongly the parameters are adjusted. The larger the value, the faster the coefficients approach a local optimum. However, if the value is too large, the algorithm may not converge.
Typically, the Linear Regression Fitting function block is first used to fit the weights for the regression of a target variable. Then, using the Linear Regression Inference function block and the fitted weights, the target variable can be predicted based on the input variables.
Optionally, a Boolean signal can be selected for the Enable Execution input so that the algorithm is only active if the value of the selected signal is TRUE.
Configuration options
- Num Channels: The number of channels that are correlated with the reference signal. This can be set via Add/Remove Channel
- File Path: Specifies the file path for the file in which the coefficients are saved at the end of the approximation process. File type: json or tas.
- Involve Existing File: If TRUE, the values for the coefficients are read from the file at the start of the analysis and then adjusted further. If FALSE, all coefficients are set to zero at the start.
- Step Size: Specifies how much the coefficients are adjusted after each new calculation.
- Bias (optional): If FALSE, the Bias Output 00 is set to zero and is not approximated further.
- Mini Batch Size (optional): Specifies over how many cycles the MSE is to be calculated before the coefficients are adjusted based on it.
Output values
- MSE: Specifies the MSE (mean squared error) between the calculated Result value and the Dependent input value.
- Result: Outputs the approximated value for the inputs of the current cycle with the coefficients updated from them.
- Output00 .. Output0n: Shows the calculated coefficients.
Standard HMI Controls
For the Linear Regression Fitting algorithm, the following HMI controls are available for generating an Analytics Dashboard:
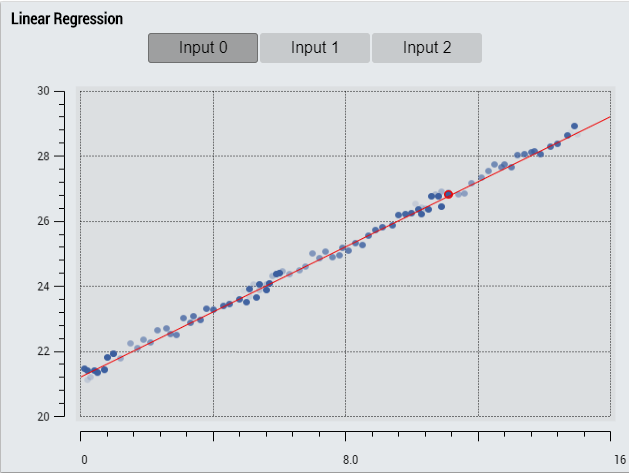
1. The Linear Regression Control visualizes the inputs and the calculated regression line. The buttons can be used to select the input channel to be displayed on the x axis. The y axis shows the target values of the regression. A new point is outlined in red, old points gradually fade.
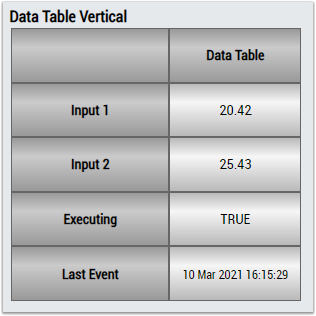
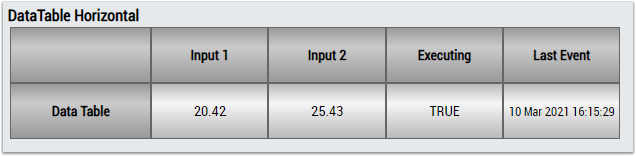
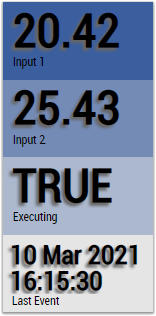
2. The Table Control or Multivalue Control visualizes all output values: MSE, result, output coefficients.
Alternatively, customer-specific HMI controls can be mapped in the Linear Regression Curve Fitting algorithm using the Mapping Wizard.