Array Statistics
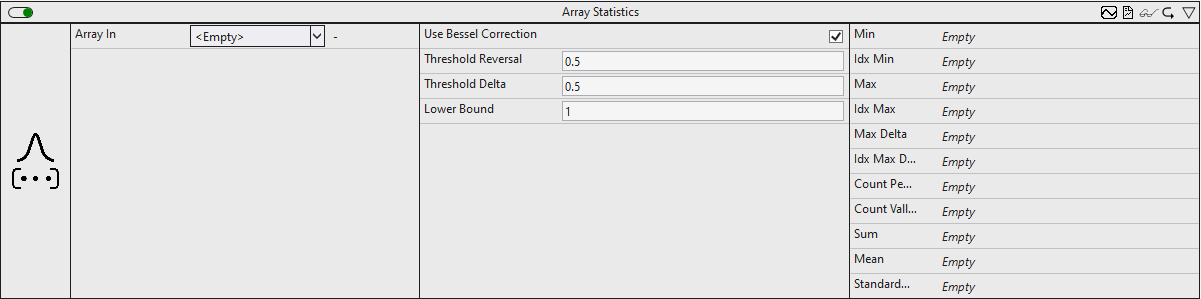
The Array Statistics algorithm calculates various statistical quantities based on the input array.
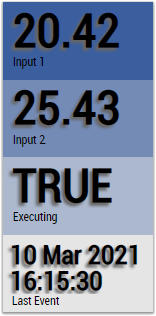
Optionally, a Boolean signal can be selected for the Enable Execution input so that the algorithm is only active if the value of the selected signal is TRUE.
Configuration options
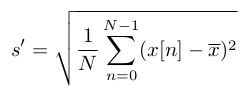
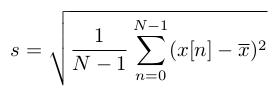
- Use Bessel Correction: if the checkbox is activated, Bessel correction will be applied. In order to obtain an expectation-true result for random samples, this parameter must be activated. The parameter is only relevant for the calculation of the standard deviation.
The empirical standard deviation, without Bessel's correction
The empirical standard deviation, with Bessel's correction
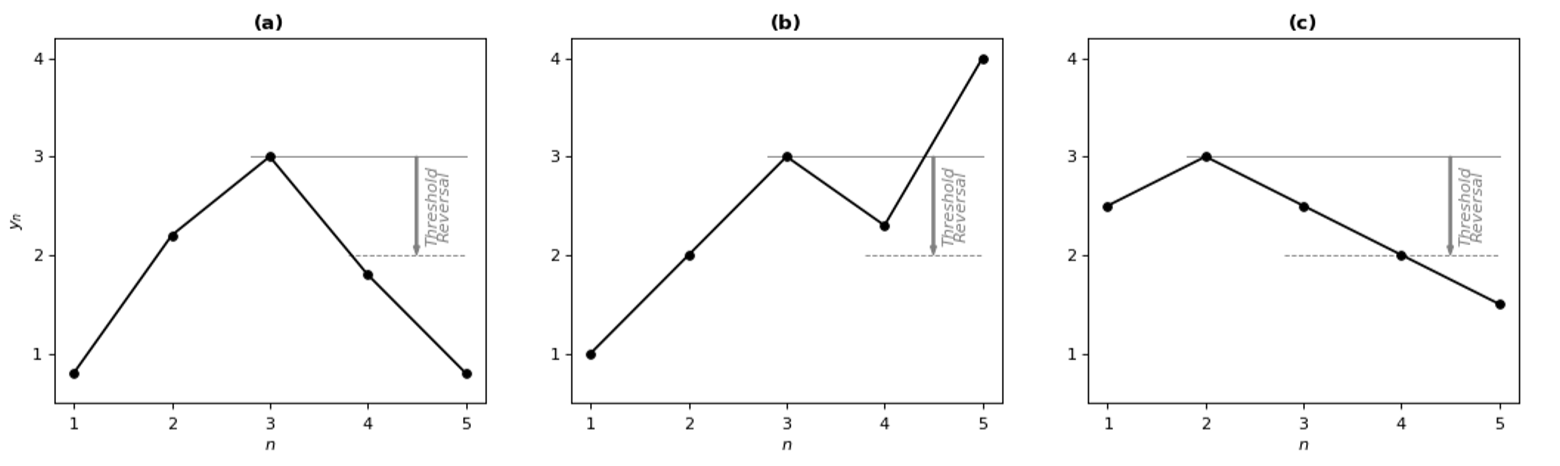
- Threshold Reversal: threshold for identifying reversals. Reversals are only detected if their difference from the next reversal exceeds the value of Threshold Reversal.
Below are three examples of peak identification using the parameter Threshold Reversal.
(a) The value y3 is identified as a peak immediately after processing the value y4 because the difference between y3 and y4 is greater than Threshold Reversal.
(b) The value y3 is not identified as a peak because the difference between y3 and y4 is smaller than Threshold Reversal and the curve starts rising again after y4.
(c) The value y2 is identified as a peak after processing the value y5 because the difference between y2 and y5 exceeds Threshold Reversal. The value y2 cannot be identified as a peak beforehand because the difference between y2 and y3 (y4) is less than/equal to Threshold Reversal and it is not known whether the values will continue to decrease.
- Threshold Delta: threshold for identifying Delta maxima. Maxima of the absolute difference of two successive values (delta) are detected only if the difference between successive deltas exceeds Threshold Delta.
Below are three examples of identifying the Delta maxima with the parameter Threshold Delta . The upper diagrams show the original input signals, the lower ones the corresponding delta.
(a) The value y4 is identified as a maximum after processing the value y5 because the difference between the two deltas exceeds Threshold Delta.
(b) No maximum is identified because the difference between the deltas is less than Threshold Delta.
(c) The value y3 is identified as a maximum after processing the value y6.
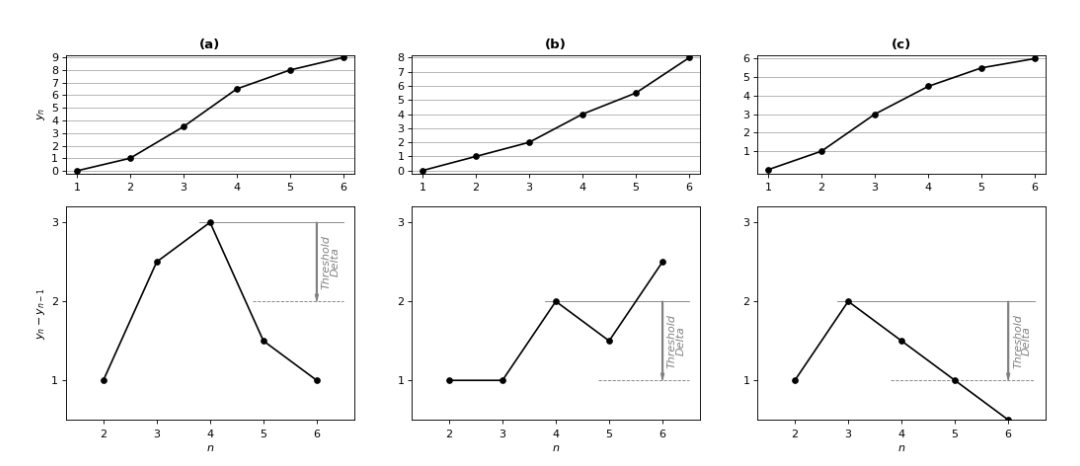
 | Regardless of Threshold Delta, at least one maximum of the Delta between two reversals is detected. |
- Lower Bound: Lower bound of the array
Output values
- Min: smallest value in the input array.
- Idx Min: array index of Min. Indexing starts at 1.
- Max: largest value in the input array.
- Idx Max: array index of Max. The indexing starts at 1.
- Max Delta: maximum of the absolute difference between two consecutive values in the input array.
- Idx Max Delta: array index of Max Delta. The indexing starts at 1.
- Count Peaks: total number of peaks identified.
- Count Valleys: total number of valleys identified.
- Sum: sum over the entire input array.
- Mean: mean value over the entire input array.
- Standard Deviation: standard deviation over the entire input array.
Standard HMI Controls
For the Array Statistics algorithm, the following HMI controls are available for generating an Analytics Dashboard:
1. The SingleValue control visualizes the Sum output.
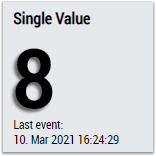
2. The SingleValue control visualizes the Mean output.
3. The SingleValue control visualizes the Standard Deviation output.
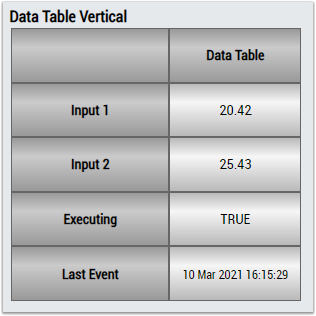
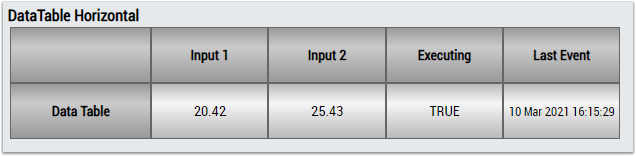
4. The Table Control or Multivalue Control visualizes the output values: Min, Max, Max Delta, CountPeaks Count Valleys, Sum, Mean, Standard Deviation.
Alternatively, customer-specific HMI controls can be mapped in the Standard Deviation algorithm using the Mapping Wizard.