Pick-and-place application: correlation
The application described below is an example application of the CorrelationFunctionReference function block.
The sample is based on data from the pick-and-place application. For this reason, a good understanding of the pick-and-place sample is a good basis for understanding this application. Data access is performed in the same way.
The aim of the application is to divide the milled shapes into two groups, oval (red) and round (yellow), based on the movement performed during the milling process.
The movement of one of the two movers on which the tray is mounted was previously recorded for the two shapes and is available in the files MillingShape1.tas and MillingShape2.tas for the two different milling shapes. These sequences are each correlated with the current motion pattern. The maximum coefficient output by the CorrelationFunctionReference function block is used to determine whether the shapes match or not.
In addition, the Maximizing Lag output value of the CorrelationFunctionReference function block determines the delay in number of cycles after the miller is turned on before the shape is followed.
The figures below show the individual function blocks of the application.
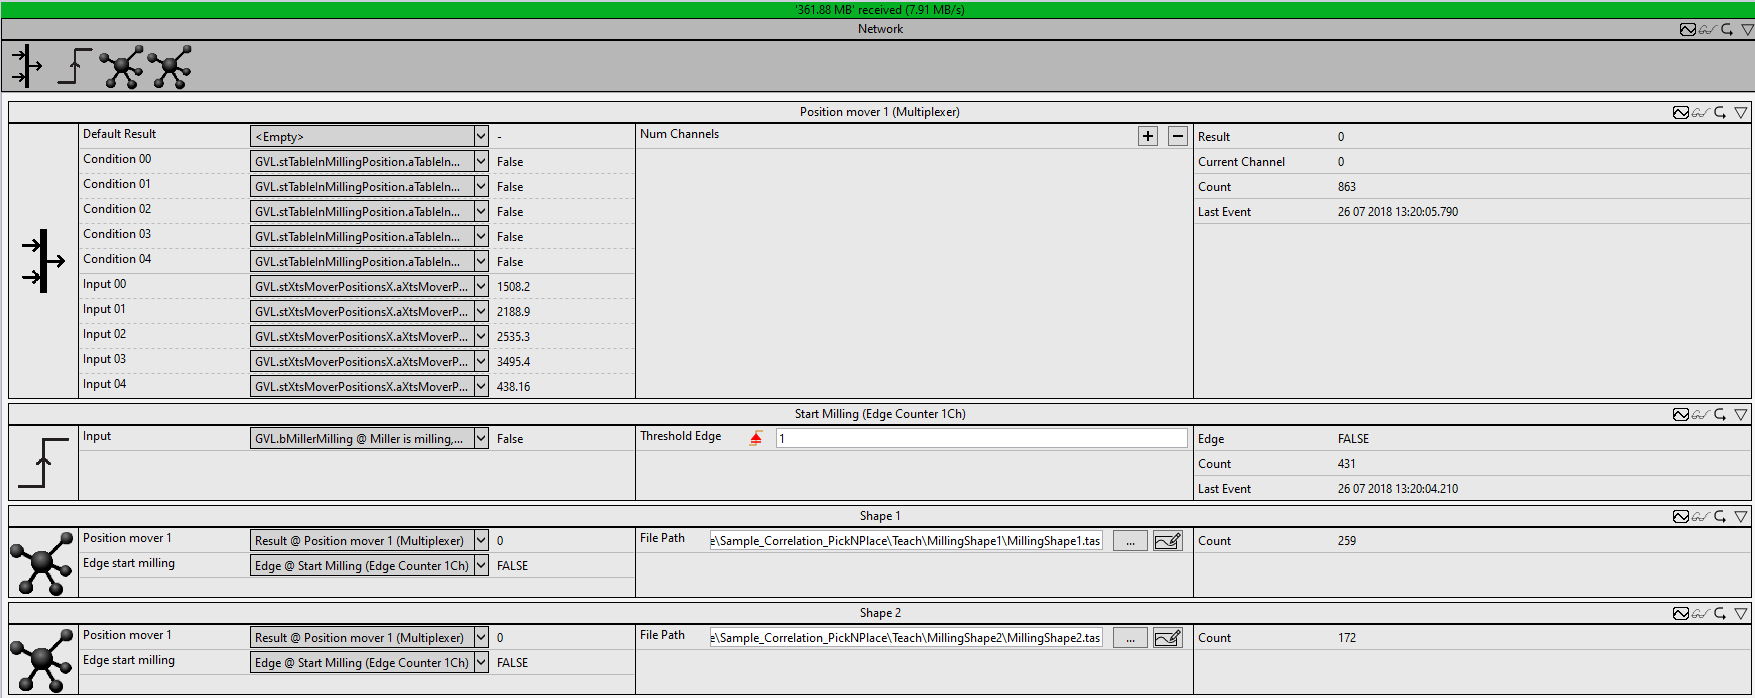
The Position Mover 1 (Multiplexer) function block is used to extract the position of the first mover belonging to the tray whose workpiece is currently being milled. This is also the mover for which the motion profile is available over the course of the milling process for the two shapes. For the analysis, it is not necessary to consider both movers of a tray, since the movers are mounted at a constant distance from each other and thus have the same motion profile.
The function block Edge Counter (Start Milling) outputs a rising edge when the milling process begins. This edge is required as input for subsequent function blocks.
The calculations of the correlations are performed individually for each milling shape in a separate network.
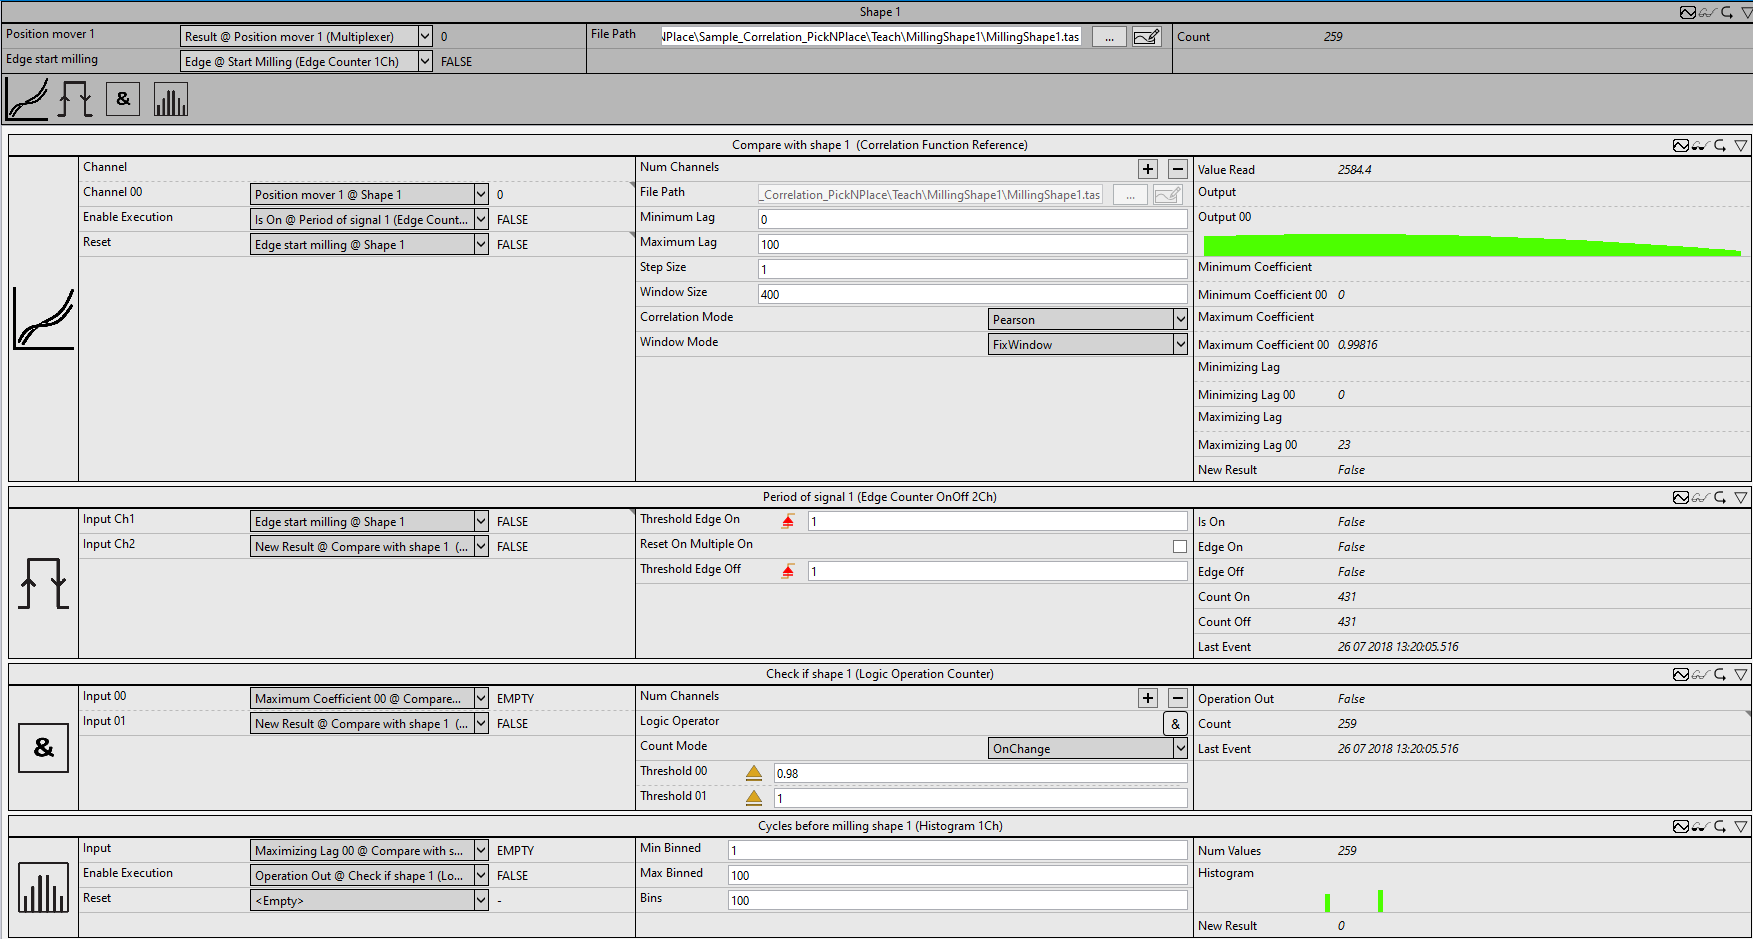
In the function block Compare with shape 1 (Correlation Function Reference), the position of the mover (Result output of the multiplexer function block) is correlated with the recorded signal of the first shape. The correlation calculation starts with the switching on of the miller. This is achieved by linking the Reset input to the rising edge to turn on the miller (edge output from Start Milling (Edge Counter 1Ch)). This is because the correlation calculation starts again with each rising edge of this function block.
 | Before starting the application, the path to the reference file must be set. The reference file is located in the project directory in the folder "Teach\MillingShape1\MillingShape1.tas". |
To get new results only when milling is in progress, the Enable Execution input of the correlation function block is linked. Here, the Is On output of the subsequent function block Period of Signal 1 (Edge Counter OnOff 2Ch) is linked. This becomes TRUE when the miller is turned on and FALSE again, if all values from the file have been used once for the correlation calculation and the correlation function block has updated its outputs. The Check if shape 1 (Logic Operation Counter) function block returns TRUE if the maximum Pearson correlation coefficient is greater than 0.98 after comparing the sequences. This way, the number of milled parts with shape 1 is also counted.
For the milling procedures, which are thus assigned to the first shape, the function block Cycles before Milling Shape 1 (Histogram 1Ch) determines the distribution of the number of cycles that have elapsed between switching on the miller and driving along the contour.
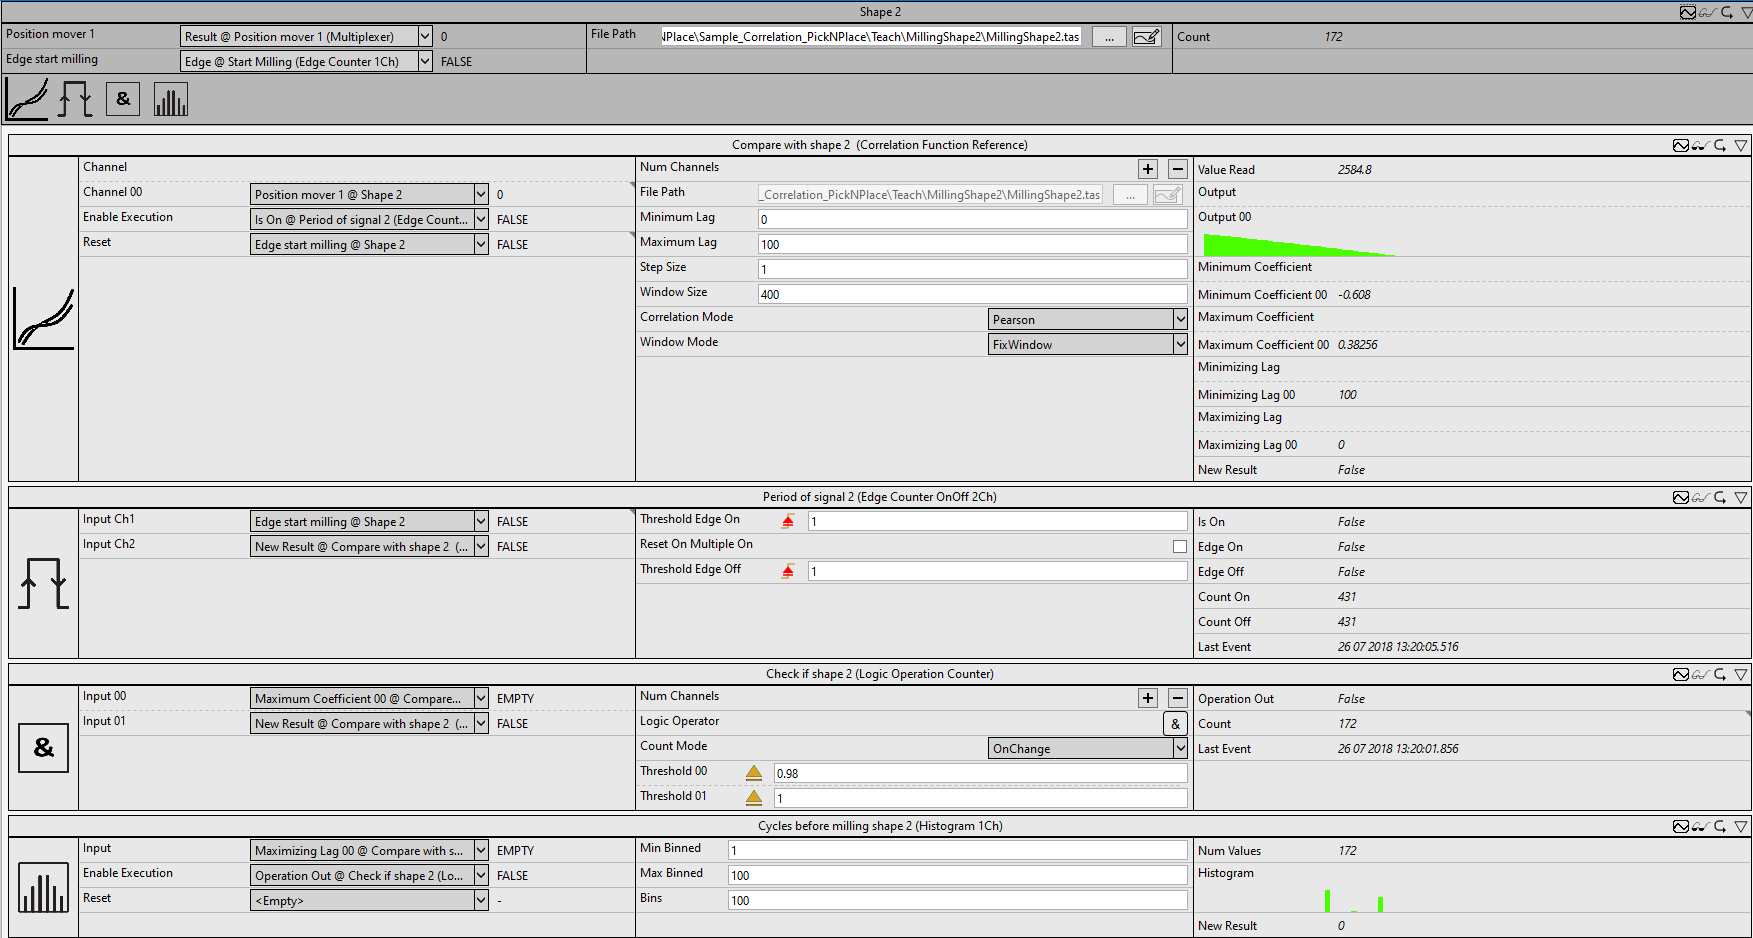
The correlation calculation of the second milling shape is performed analogously in a separate network.
The scope plots below visualize the results from the analysis.
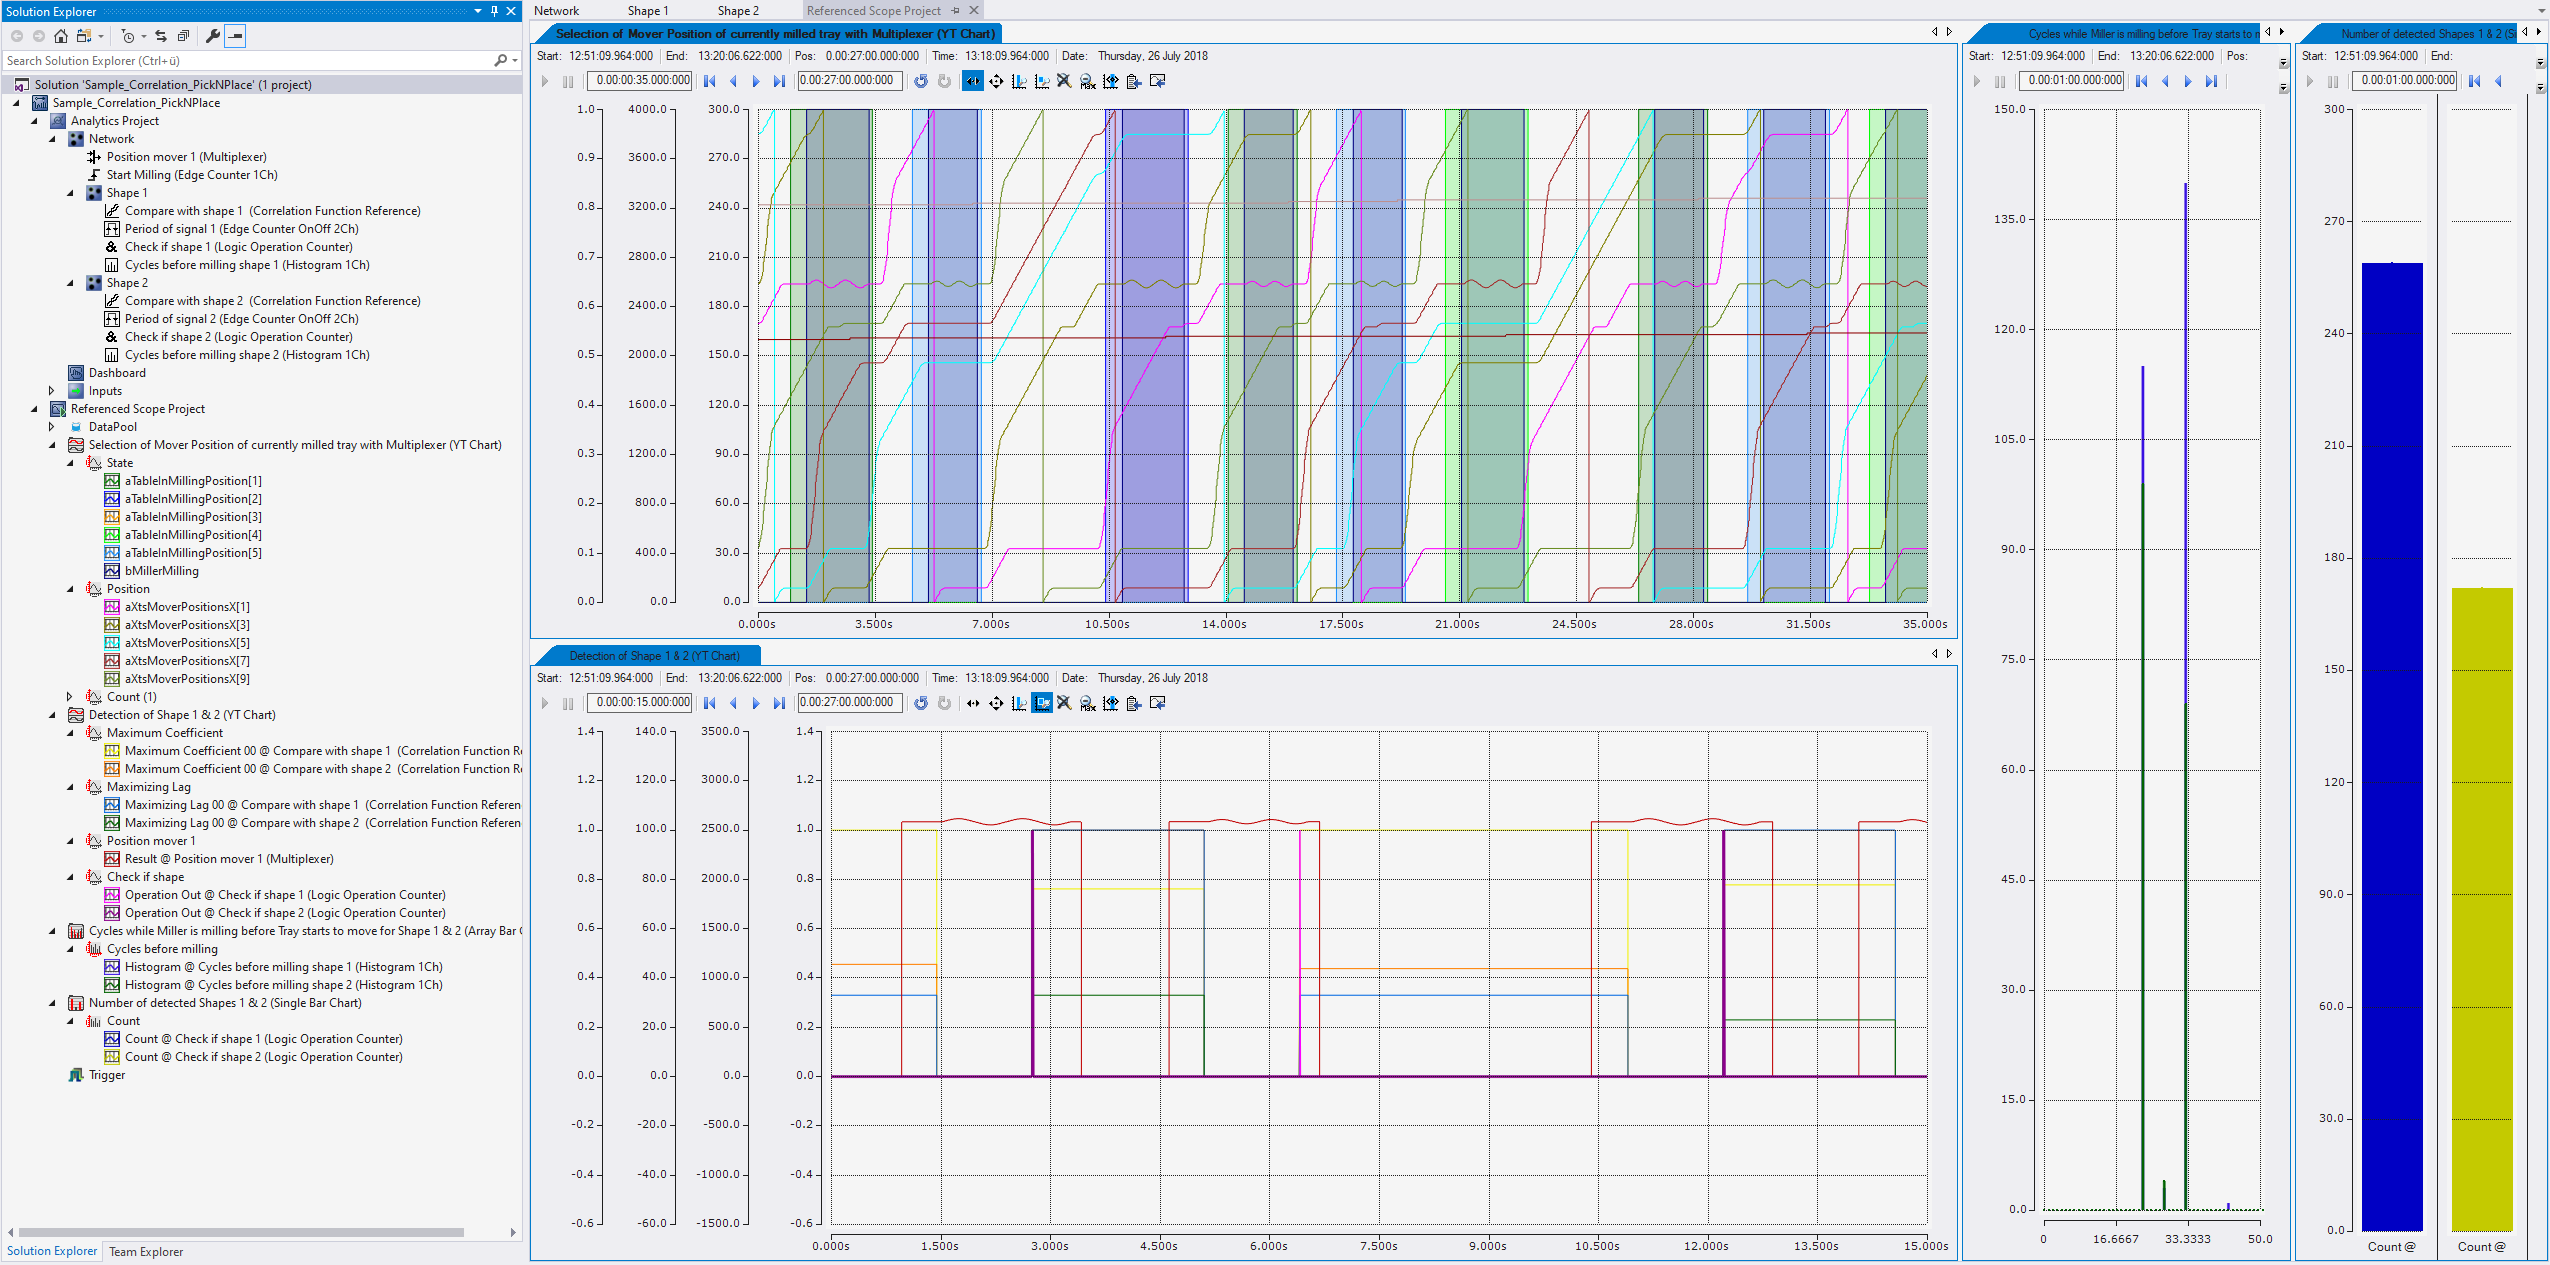
The upper left chart shows the inputs and the Result output of the multiplexer. It can be seen that the mover follows a sinusoidal path when the corresponding tray is in the position of the miller.
In the lower left chart, the Result output of the multiplexer is shown in red. The two function blocks Check if shape 1 (Logic Operation Counter) and Check if shape 2 (Logic Operation Counter) each have a peak (pink and purple) if the correlated sequence has achieved a maximum coefficient (yellow and orange) greater than 0.98. In the section shown, you can check that these results match the different curves of the Result output of the multiplexer. Also shown in blue and green are the corresponding Maximizing Lag outputs of the correlation function blocks.
The left of the two bar charts shows the Maximizing Lag outputs of the correlation function blocks. They result from the results of the histogram function blocks. Both shapes produce large deflections at a lag of 23 as well as a lag of 33 and a small deflection at a lag of lag 28. The first shape generates a unique lag of 43 cycles.
The right-hand bar chart shows the number of parts that have been assigned to shape 1 and 2. 259 parts were assigned to the first shape and 172 parts to the second.