Pick-and-place application: DenStream
The application described below is an exemplary application of the DenStream function block.
The sample is based on data from the pick-and-place application. For this reason, a good understanding of the pick-and-place sample is a good basis for understanding this application. Data access is performed in the same way.
The aim of the application is to divide the milled shapes into two groups, oval (red) and round (yellow), based on the movement performed during the milling process.
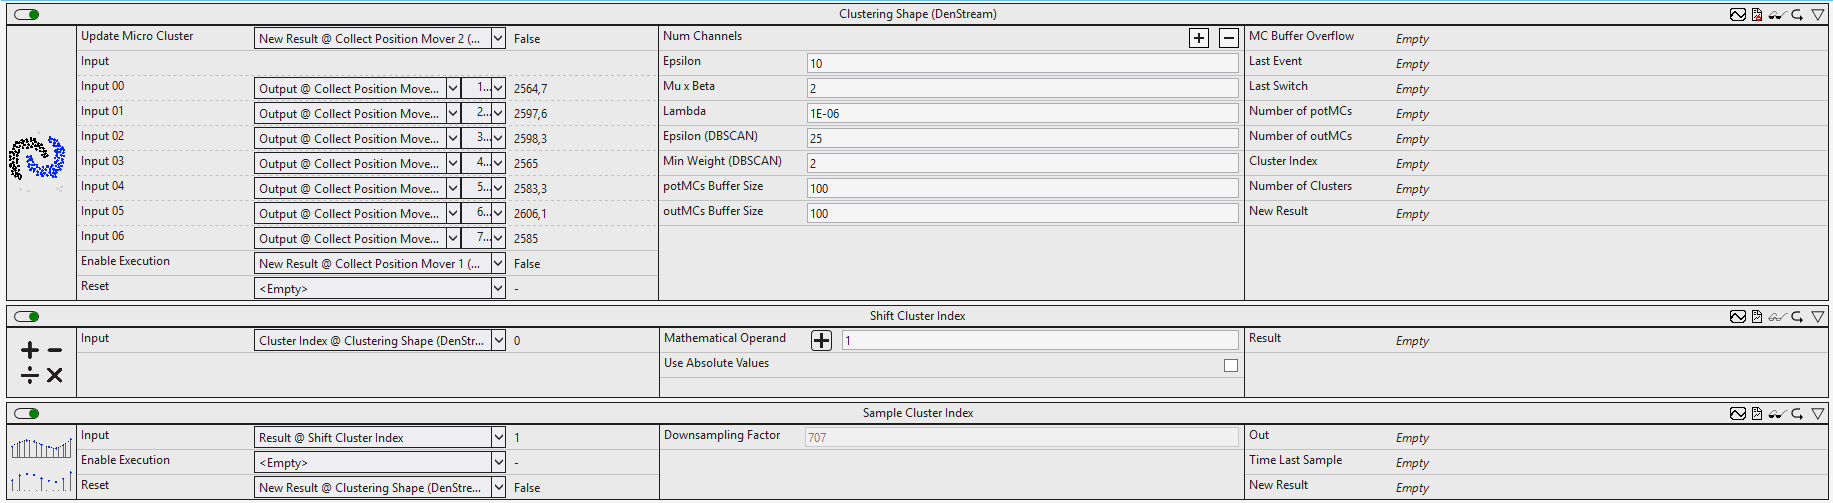
The figures below show the individual function blocks of the application.
The trays for the workpieces are fixed with two movers each on the XTS track. Therefore, there are two position values per tray, which can be used to map the milled shape in a Scope project. In this case, one of the positions is sufficient to determine the cluster that is sampled at seven different times during the milling process. These seven values are then processed at the same time as individual inputs in the DenStream function block and form the seven-dimensional feature space.
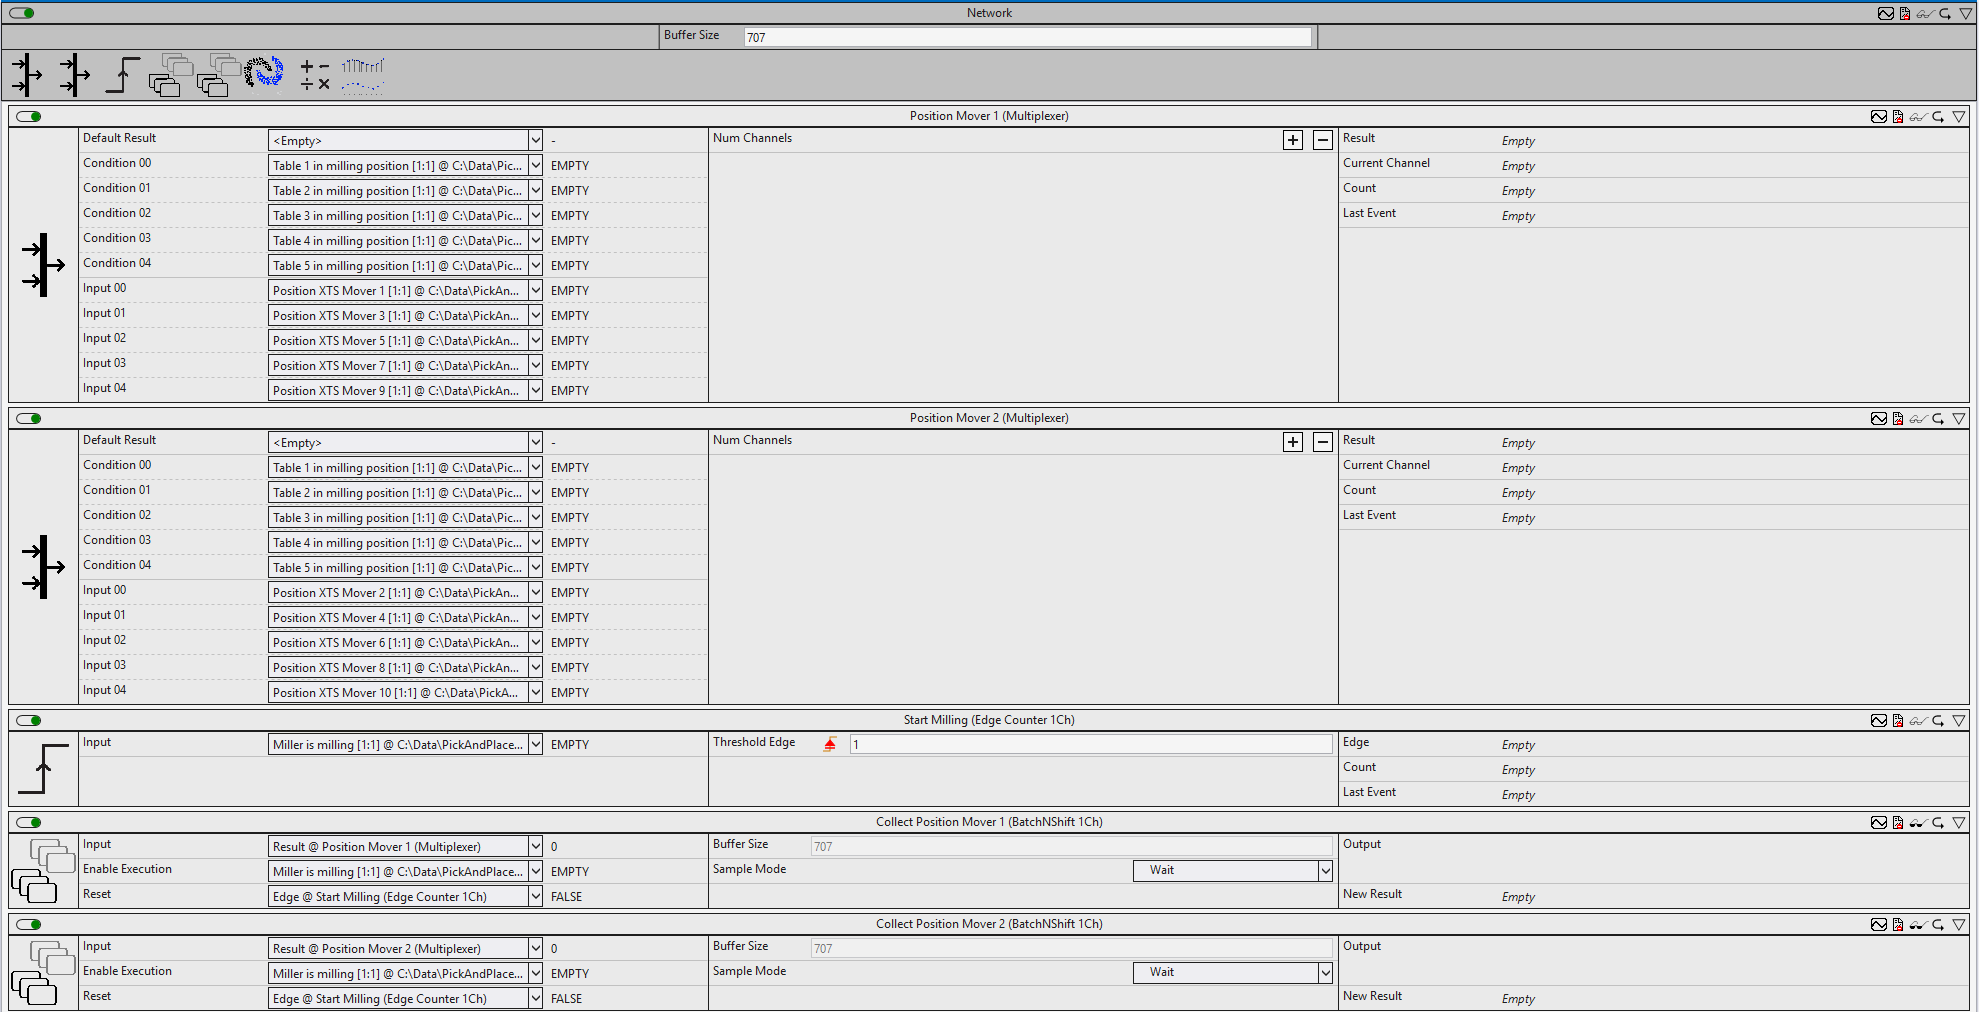
With the help of the function blocks Position Mover 1 (Multiplexer) and Position Mover 2 (Multiplexer) the position of the two movers of the tray whose workpiece is currently being milled is extracted.
The function block Edge Counter (Start Milling) outputs a rising edge when the milling process begins. This is required as input of subsequent function blocks.
The two downsampling function blocks (Sampling Position Mover 1 & Sampling Position Mover 2) store a position value every 100 cycles (downsampling factor) over the milling process, starting with the rising edge of bMillerMilling. The function blocks are only active when milling is taking place (bMillerMilling == TRUE).
The outputs of the downsampling blocks are each linked to an input of a BatchNShift function block (Collect Position Mover 1 & Collect Position Mover 2). These summarize the values in a batch. The batch is output only when the number of eight values (Buffer Size) is reached.
Finally, the outputs of the first BatchNShift are linked to the inputs of the DenStream function block. The first value is discarded because the position at the beginning of the milling process is independent of the milling shape and therefore does not contain any information for the classification.
The micro clusters are updated only when the DownsamplingBuffer function block updates its outputs. In order to estimate the parameter values for Epsilon and Epsilon (DBSCAN) correctly, you can look at the distances between the individual input variables for the different milling shapes in a plot. Since the milling shapes do not change over time, the parameter value Lambda is set very low and could also be set to 0.
The scope charts show the results from the analysis.
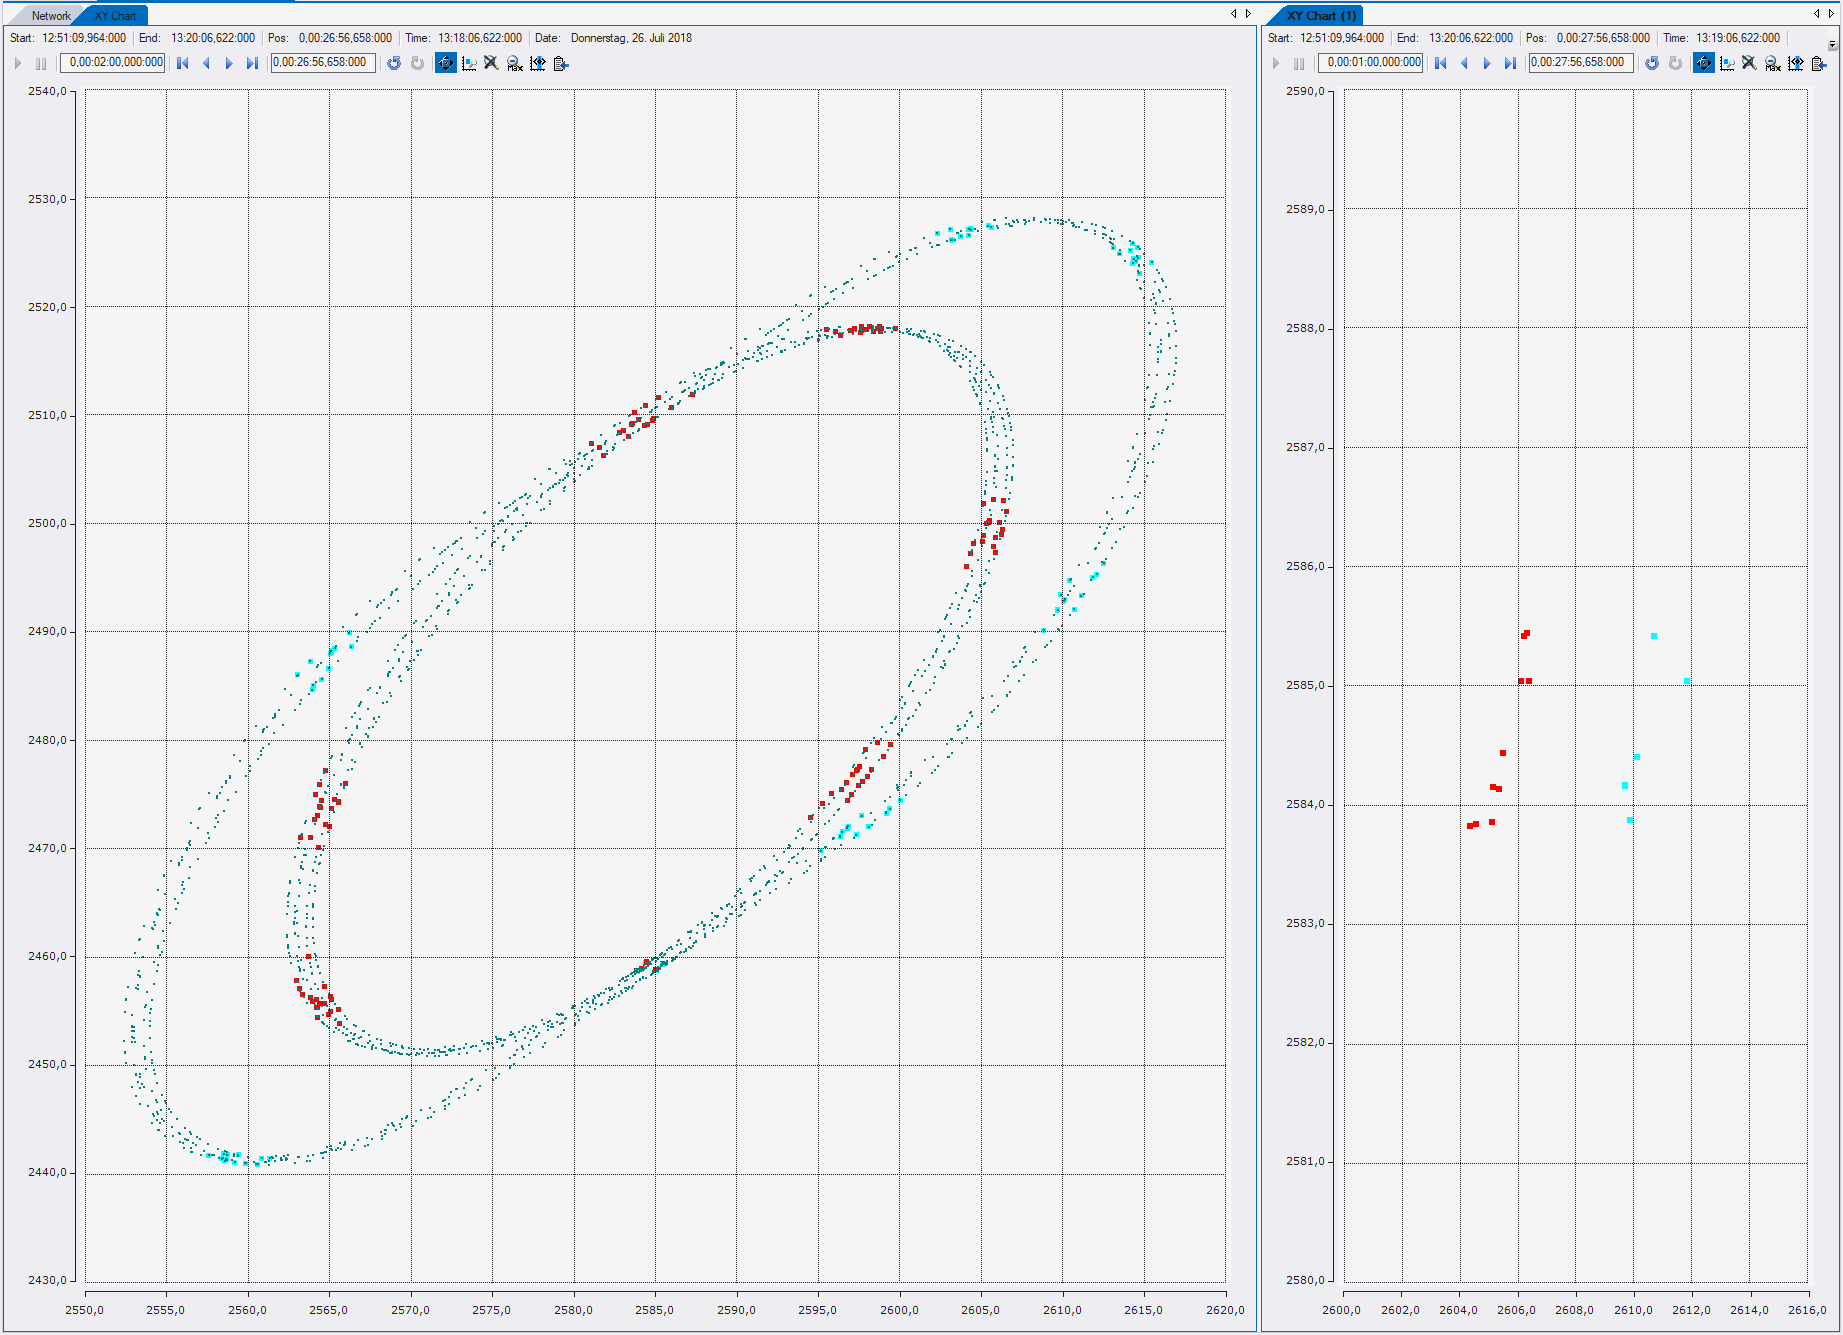
If the position of the two movers of a tray is presented in an XY chart, these show the movement curve that is traversed by the trays during milling. The motion curve is shown in black in the left plot. In the time period shown here, both milling shapes were driven several times. The points used as inputs for the DenStream function block are shown in color. Dynamic styles display the points in different colors depending on the associated cluster index. It can be seen that the clusters have been correctly assigned. The points representing the oval milling shape are turquoise, while those for the others are red, therefore different cluster indices have been assigned to them.
The feature space of the clusters is not displayed. Since this is seven-dimensional, it cannot be directly visualized. Two features (Input 05 and Input 06) are shown in the right-hand plot. It can be seen that the points of the two clusters are spatially separated from each other