Correlation Function
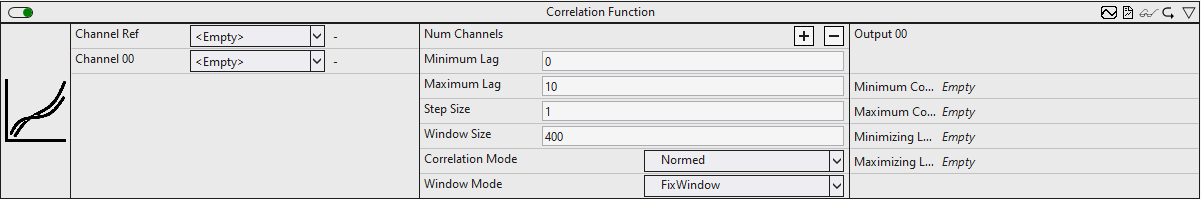
The Correlation Function function block calculates the discrete correlation function between a reference signal (Channel Ref) and one or more other signals (Channel 00, ..., Channel 0n). The correlation coefficients are calculated for time shifts of m cycles between the two signals, with the maximum and minimum values for m being limited by the parameters Minimum Lag (negative integer) and Maximum Lag (positive integer).
The Step Size parameter determines the number of cycles by which the signals are moved to calculate two consecutive correlation coefficients. I.e. m is always a multiple of StepSize. Accordingly, for Minimum Lag and Maximum Lag only multiples of StepSize are allowed. If the StepSize is set to one and Minimum Lag is set to -6 and Maximum Lag is set to +4 -for example-, correlation coefficients are calculated for shifts of -6, -5, -4, -3, -2, -1, 0, +1, +2, +3 and +4 cycles. If the StepSize is set to two, coefficients are calculated for shifts by -6, -4, -2, 0, +2 and +4 cycles.
The coefficients can be calculated over different timeframes, which are set by the Window Mode parameter. In Continuous mode, all values since the beginning of the analysis are included in the calculations. In SlidingWindow mode, the calculation runs continuously for the last number of cycles set by the Window Size. In FixWindow mode, the calculation is also done for the number of cycles set by the Window Size. However, the calculation restarts after each WindowSize cycle and the output values are updated only when the last cycle of a window is run through.
If m is not zero, the window for the corresponding signal shifts by m cycles. The number of values included in the calculation of the coefficients is the same for all values of m. The only exceptions to this are the results from the first cycles after the start of the analysis. If the number of elapsed cycles is less than |m|, correspondingly fewer values are included in the calculation.
For positive values of m, the values of the reference signal (Channel Ref) are stored in a ring memory, so that the respective value of the reference signal received before m cycles can be compared with the current values from Channel 00 to Channel 0n. This corresponds to a shift of the reference signal into the past. For negative values of m, the reference signal would accordingly have to be moved into the future. Since this is obviously not possible, the second signal (Channel 00, .. Channel0n) is saved and moved backward instead.
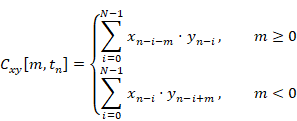
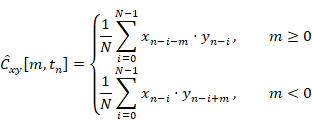
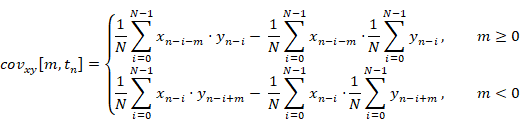
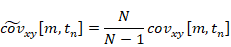
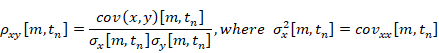
The correlation coefficients can be calculated according to different calculation rules. This is determined by the Correlation Mode. In the Base and Normed modes, the coefficients are calculated analogously to the definition from signal processing, which calculates the correlation over the convolution. In Normed mode, the coefficients are also divided by the number of summands. Covariance and CovarianceBessel calculate the covariance without and with Bessel correction. Pearson mode uses the definition of the Pearson correlation coefficient commonly used in statistics. The exact calculation rules are mathematically listed in the configuration options. Here, xn denotes the value of the reference signal and yn denotes the value of the second signal (in each case Channel00, ..., Channel0n) at the timestamp tn (corresponding to the nth cycle since the start of the analysis or since reset, except for the cycles in which Enable Execution = FALSE). The value of N depends on the WindowMode you select. For SlidingWindow mode and FixWindow mode, N is equal to the WindowSize, provided a corresponding number of cycles have already elapsed since the start of the analysis, so that xn-N-m (or yn-N+m) has been recorded, otherwise N will be reduced to n-m+1 or n+m+1 respectively. Note that in FixWindow mode the output values are only updated every WindowSize cycle. In Continuous mode, N = n+1 always applies.
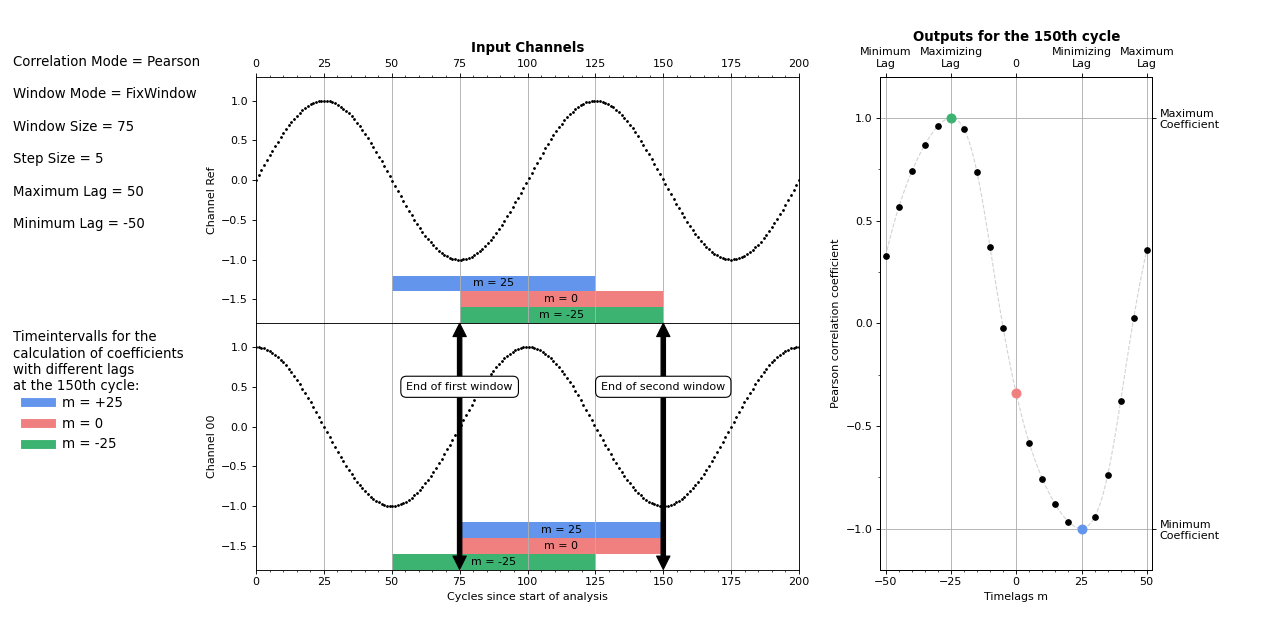
In the illustration, the output values of the function block for two signals (Channel Ref and Channel 00) for a given cycle (n = 150) are shown as an example of a configuration (Correlation Mode = Pearson, Window Mode = FixWindow, Window Size = 75, Step Size = 5, Maximum Lag = 50, Minimum Lag = -50). In the two left plots, the input signals Channel Ref and Channel 00 are shown over time. The right plot shows the discrete correlation function (the Pearson correlation coefficients in relation to m). Coefficients are shown for the shifts m = -50, -45, -40, -35, -30, -25, -20, -15, -10, -5, 0, +5, +10, +15, +20, +25, +30, +35, +40, +45, +50. These are output as an array in the function block. In addition to the two parameters Minimum Lag and Maximum Lag, the output values Minimizing Lag and Maximizing Lag are marked on the abscissa. The corresponding coefficients Minimum Coefficient and Maximum Coefficient, which also represent outputs of the function block, are marked on the ordinate. For the shifts m = -25, m = 0 and m =+25 in the plots of the input channels (left), the time ranges included in the calculation of the respective coefficient are highlighted in color. In the right plot, the corresponding points are colored.
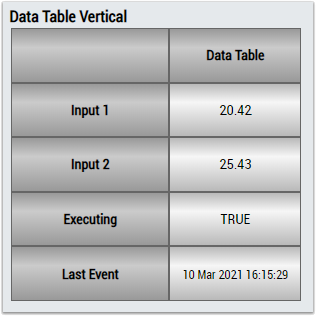
Optionally, a Boolean signal can be selected for the Enable Execution input so that the algorithm is only active if the value of the selected signal is TRUE.
Configuration options
- Num Channels: The number of channels that are correlated with the reference signal. This can be set via Add/Remove Channel
- Maximum Lag: Specifies the maximum number of cycles by which the two signals are shifted to calculate the correlation to each other. This is a positive integer.
- Minimum Lag: Specifies the minimum number of cycles by which the two signals are shifted to calculate the correlation to each other. This is a negative integer.
- Step Size: Specifies by how many cycles the signals are shifted to calculate two consecutive correlation coefficients.
- Window Size: For the SlidingWindow and FixWindow window modes, specifies the number of cycles over which the coefficients are calculated. The windowing has no effect for the Continuous Window Mode and cannot be set. In SlidingWindow mode, Window Size values for all channels are buffered in addition to Maximum Lag values from the Reference Channel and Minimum Lag values for Channel 00 to Channel 0n. The size of the router memory should therefore be taken into account when setting these parameters.
- Correlation Mode: The correlation coefficients are calculated according to one of the following definitions:
- Base:
- Normed:
- Covariance:
- CovarianceBessel:
- Pearson:
- Window Mode: Specifies the type of window used to calculate the coefficients:
Continuous: All values since the start of the analysis are included in the analysis with equal weighting.
SlidingWindow: The calculation is done via a window of the size Window Size. The current values are always included in the analysis and outputs are updated with each cycle.
FixWindow: The outputs are updated every Window Size cycles and calculated via a window with the length Window Size.
Output values
- Output00 .. Output0n: Shows for each input (Channel00, ..., Channel0n) the coefficients for the shifts m = Minimum Lag, m = Minimum Lag + Step Size, ..., m = - Step Size, m = 0, m = +StepSize, ..., m = Maximum Lag as an array.
- Minimizing Lag00..Minimizing Lag0n: For each channel, specifies the shift for which the coefficient becomes minimum.
- Minimum Coefficient00..Minimum Coefficient0n: Specifies the minimum coefficient for each channel.
- Maximizing Lag00..Maximizing Lag0n: for each channel, specifies the shift for which the coefficient becomes maximum.
- Maximum Coefficient 00..00.. Maximum Coefficient0n: Specifies the maximum coefficient for each channel.
Standard HMI Controls
For the Correlation Function algorithm, the following HMI controls are available for generating an Analytics Dashboard:
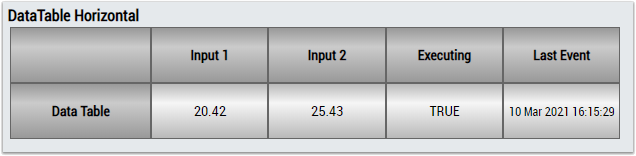
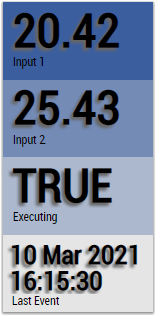
1. The Table Control or Multivalue Control visualizes all output values: minimum coefficient, maximum coefficient, minimum lag, maximum lag and the coefficient array.
Alternatively, customer-specific HMI controls can be mapped in the Correlation Function algorithm using the Mapping Wizard.