State Histogram 1Ch

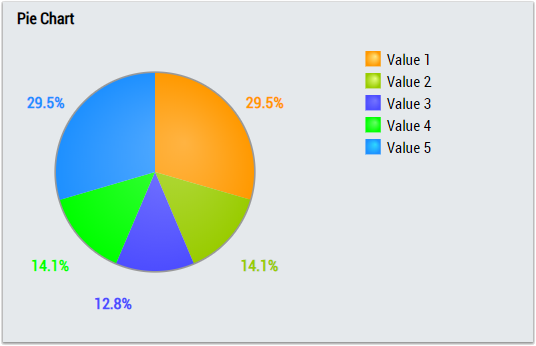
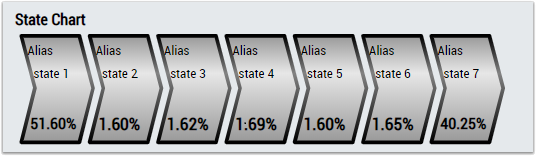
The State Histogram 1Ch counts how often the input signal (INT) has a specific value between the configured minimum and maximum and shows the distribution in a histogram. The first bar represents the boundary values which are smaller than the minimum and the last bar represents the boundary values which are greater than the maximum. The State Histogram 1Ch is suitable for state-machines to show how often the different states are executed.
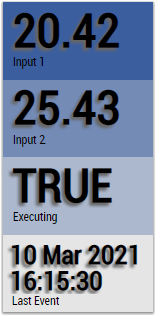
Optionally, a Boolean signal can be selected for the Enable Execution input so that the algorithm is only active if the value of the selected signal is TRUE.
Configuration options
- Histogram Mode: The operation mode of the histogram. A distinction is made between absolute and relative output. The latter can be used to display the percentage distribution.
- Min: Minimum value to be analyzed.
- Max: Maximum value to be analyzed.
- Enable Display Names: Enable Histogram Display Names. This configuration is visible hidden in the property window.
- Histogram Display Names: Display names of the individual bins. This configuration is hidden in the Property window and is used for the HMI.
Output values
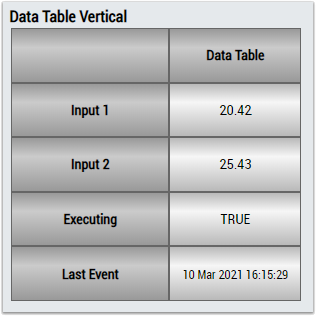
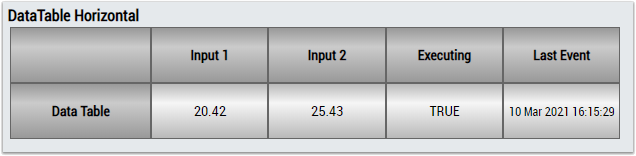
- Num Values: Indicates the total number of states executed between the configured borders.
- Histogram: The histogram is displayed below the Num Values. The respective value is indicated on each bar. If you move the cursor over the bars, you will see a tooltip with the value interval and the corresponding value of the histogram bin.
Standard HMI Controls
For the State Histogram 1Ch algorithm, the following HMI controls are available for generating an Analytics Dashboard:
1. The PieChart control visualizes the output value histogram.
2. The StateHistogram control visualizes the output value histogram.
3. The Table Control or Multivalue Control visualizes all output values: Num Values, Histogram.
Alternatively, customer-specific HMI controls can be mapped in the State Histogram 1Ch algorithm using the Mapping Wizard.