Tracks
Tracks are elements of the Data Track Editor, which contain information about the contained data and the structure of the symbolism.
Presentation
The area provided for tracks in the Data Track Editor has the following elements:
|
|
This button opens a new Track Editor Export window. |
|
|
Clicking on it opens a popup where settings for the display of the tracks can be made. |
|
|
Clicking on it opens a popup where settings for the timeline and the time tracks can be made. |
|
|
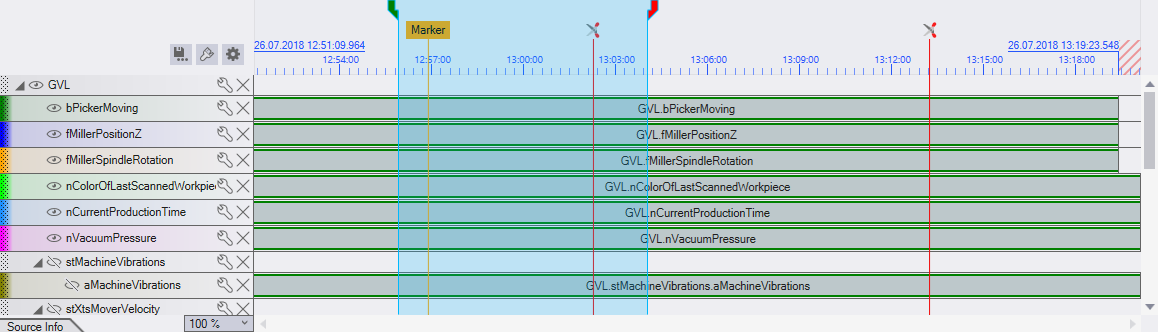
The blue area lies above the tracks and represents which data is displayed in the chart. Also, the selected area is used for some toolbar functions. The red and green areas can be moved to increase or decrease the selection. If clicked between the red and green area, the selected area can be moved. On the left and right edges, the selection can snap. This happens near marker and track ends. To ignore the snap function, hold down the Alt key while moving. The selection cannot be smaller than 10 values. |
|
|
Markers are displayed both in the tracks and in the chart. In the tracks, markers can be renamed by clicking on the text, and markers can be removed by right-clicking. The markers that do not have text but scissors are special markers that can be used for cut-outs. |
|
|
The timeline has the start time marked at the left end. Markers then follow at even intervals, indicating the time present there. |
|
|
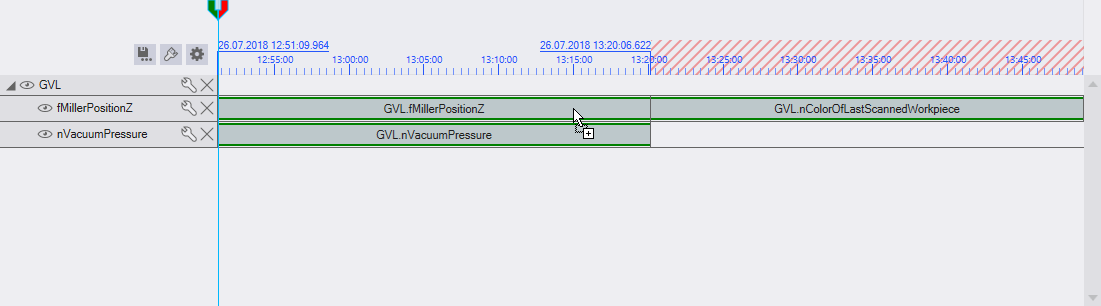
At the right end of the timeline is a marker for the end time. The end time corresponds to the start time plus the number of samples from the track with the fewest samples multiplied by the cycle time. If the number of samples in the tracks differs, a red dashed area is displayed behind the end time marker. This area will not be exported, as data is not available for all tracks. |
|
|
Gaps between data elements are displayed in red dashed lines in the timeline. All red dotted areas are not exported. Right-click to open a context menu with which the gap can be closed. |
|
Tracks Container |
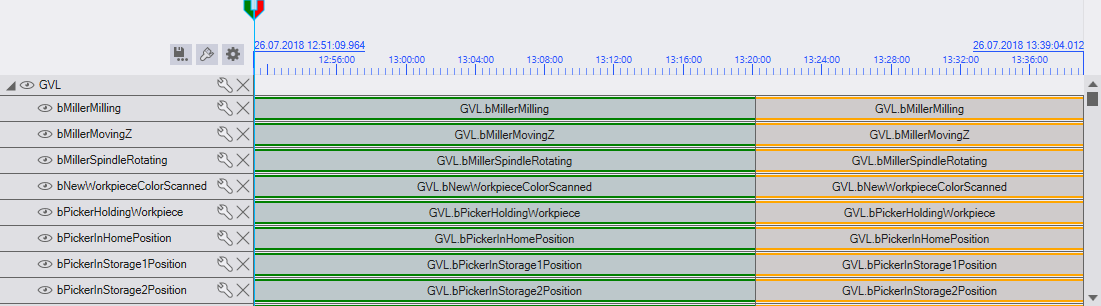
The tracks are displayed in the lower section, with the data from the tracks starting at the start time. The new symbolism is displayed in front of it. |
|
|
Below the track container there is an option to zoom the tracks. When zooming, only the part of the tracks with data elements is enlarged horizontally. A value can be selected from the defaults or a free zoom value from 100 % to 7000 % can be entered. If the mouse pointer is over the area for data elements and the [Ctrl] key is held down, the zoom value can be changed using the mouse wheel. The vertical size of the tracks can be changed in the settings for the display |
|
|
This button can be clicked or dragged to display a legend about the sources of the Data Track Editor. The legend has two display options, depending on the size of the legend. If the legend is large enough, detailed information such as the type of source or file path is displayed. The sources are also displayed below the Track Editor node in the Solution Explorer. To change the color or name of a source, the node in the Solution Explorer and the properties window can be used. |


Display options
Clicking the  button opens a pop-up with the following setting options:
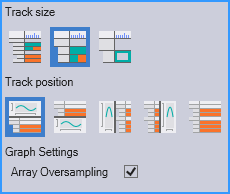
The track size setting changes the height of tracks and the details in tracks and data elements. The small display size provides an overview of the Track Editor and the large display size allows the times of the data elements to be set more accurately.
The second setting fixes the order in which the chart and tracks are displayed.
The other option is for displaying the graphs in the chart. The Array Oversampling option sets the current and default value of the oversampling option for all array and container tracks. This value can also be set individually in the track options  .
.
Data Tracks
Currently there are two types of tracks that can contain data. The first is the single track. This represents a single symbol. The second is the array track, which represents an array symbol. The third is the multi-track. This can group multiple symbols together, keeping the presentation simple. In multi-tracks, for example, the data types or names of the symbols contained cannot be customized.
Tracks that contain data are displayed in a similar way.

On the left side are the following functions:
|
|
Here you can define whether the track should be visible as a graph in the chart or not. |
|
Track Name |
The name of the track is used in the chart for the graph and in the export as the symbol name. The name must be unique below a container and cannot contain spaces. |
|
|
Clicking on it will open a popup. This shows the track settings (see Settings). |
|
|
This button removes the track and all the tracks under it. |


On the right side the data elements of the track are displayed. Data tracks can contain multiple data elements that match the type of track (e.g. a single track cannot contain an array).
Container Tracks
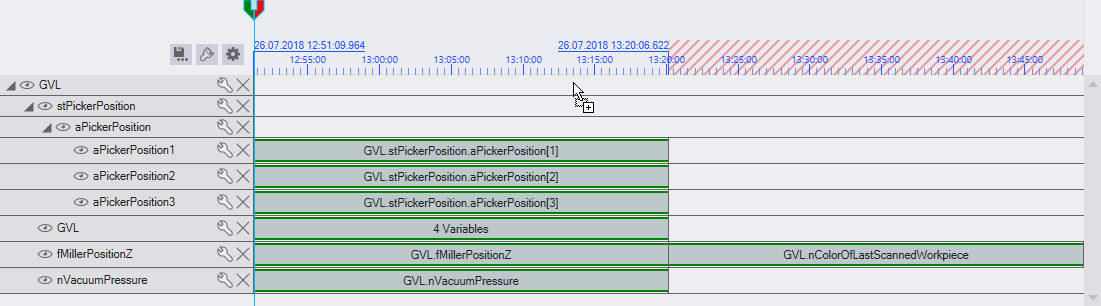
Container tracks are structured similarly to data tracks. However, no data elements can be in container tracks, but they can contain tracks. Included tracks are displayed below the container track and can be expanded or collapsed using the  buttons. When a container track is made visible or invisible, all subtracks become visible or invisible as well.
Empty tracks can be added to a container track. To do this, the mouse pointer must be over the area for data elements and one of the two buttons must be clicked 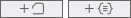 . One button adds an empty single track, the other an empty container track.
Settings
For all types of tracks there are different settings in the popup of the button.
Single track settings:
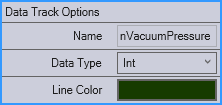
|
Data Type |
Here you can define the data type of the single track. The displayed as well as the exported data will be converted to the types specified here. For string data types, another text field is displayed, which determines the length of the string. If the data type could cause problems during conversion because one or more data elements of the track have a larger data type, a warning is issued, but the values are converted. |
|
Lines color |
Sets the color of the graph in the chart. When you click on it, a color picker is displayed in which you can set the color. |
Array track settings:
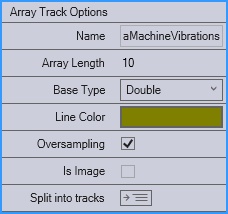
|
Array length |
Determines the number of elements in the array. Fixed setting. Data elements must have the same array length in order to be added to the array track. |
|
Base data type |
Here, the data type of the array elements can be specified. The displayed and exported data is converted to the type specified here. |
|
Lines color |
Sets the color of the graph in the chart. When you click on it, a color picker is displayed in which you can set the color. If oversampling is deactivated, gradations of the selected color are selected for the individual graphs. |
|
Oversampling |
If this option is active, all values of the array are displayed in one graph. To do this, the values of the array elements are loaded and all values of the same time are placed one after the other. |
|
Split |
Converts the array track into a container track, which has a separate single track for each array element. |
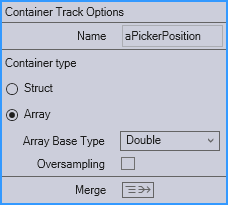
Container track settings:
|
Container type |
A container track can be a structure or an array. To be created as an array, however, all subtracks must be compatible to form an array. If only single tracks are available, a container track can be made into an array with a primitive data type. If there are only container tracks that have the same structure, the container track can be made into an array with primitive array or structure as the base data type. |
|
Merge |
Converts the container track into a multi-track. The tracks in the container track are saved as variables of the multi-track. This function is only available if the data elements of all subtracks have the same structure. So start at the same point, are from the same source and have the same time period of the source. For containers of container type Array with a primitive basic data type, an Array track is created instead of a multi-track. |
Each container type has its own properties:
|
Structure |
Structure Name |
Specifies the desired name for the data type in the export. |
|
Array |
Base data type |
Here you can set the data type for the array elements. Setting the data type here changes the array base data type of subcontainer track and the data type of sub single tracks. For string data types, the length of the string can be set. |
|
|
Oversampling |
This option is only available if the container track has only single tracks as subtracks. When active, the subtracks are not displayed as individual graphs in the chart, but the container track is displayed as one graph. For this purpose, the values of the subtracks are loaded and all values at the same time are placed one after the other. |
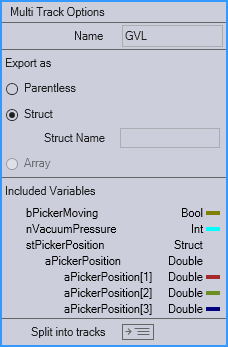
Multi-track settings:
|
Export as |
Similar to the container type of container tracks, you can set how the multi-track should be handled in the export. Structure: The multi-track is exported as a structure data type with the variables it contains as elements. The desired name for the structure can be specified. The option to export as array is available only if all contained variables have the same data type. The data type cannot be changed. The multi-track becomes an array during export with the contained variables as array elements. Parentless: The multi-track is not included in the export. It is as if the variables contained were at the multi-track level. |
|
Variables included |
The symbolism present in the multi-track is displayed here. All data elements of the multi-track must have the same symbolism. |
|
Split |
Splitting the multi-track into several tracks that correspond to the structure of the variables they contain. |
Data elements
Data elements can be located in tracks. These contain one or more variables from a source, and a time range from the source. The time domain and cycle time of the source are used to calculate how many samples are contained in the data element. The length of a data element is determined by looking at which track contains the most samples and how much space is available in total. The length then depends on the number of samples and how many pixels correspond to one sample.
A data element is displayed as a block. The color of the data element depends on the source from which it originates. All data elements from the same source have the same color. There is a dividing line at the end of the data element. The data element displays the original name of the symbol from the source. If there are several symbols, only the number of symbols is displayed.
By right-clicking on a data element, the context menu can be opened. The clicked data element is highlighted in blue.
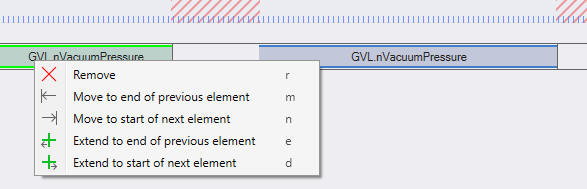
The data element can be completely removed using the context menu without using the functions from the toolbar. If there are gaps before or after the data element, there are up to four additional entries to fill the gaps. Two of these move the element to the left or right. The data is not changed in the process. The other two functions extend the data element at the beginning or end to the next data element. The data previously available in the Track Editor remains in the same place and the gap is filled with new data from the source of the data element. These functions are only available if there is still enough data in the source to expand the element.
If the large option for track size is selected in the display options, the accurate time from the source can be viewed in the data elements.
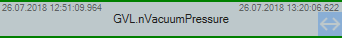
The start time at the top left and the end time at the top right can only be displayed if there is enough space. The zoom can be used to create more space for the data elements. The start time and end time can be changed directly there. It is also possible to change the start or end time using the mouse. To do this, click on the button that appears when you hover over the start or end. As long as this is held, the time is adjusted to the mouse position. The times cannot exceed the start time and end time of the source record.
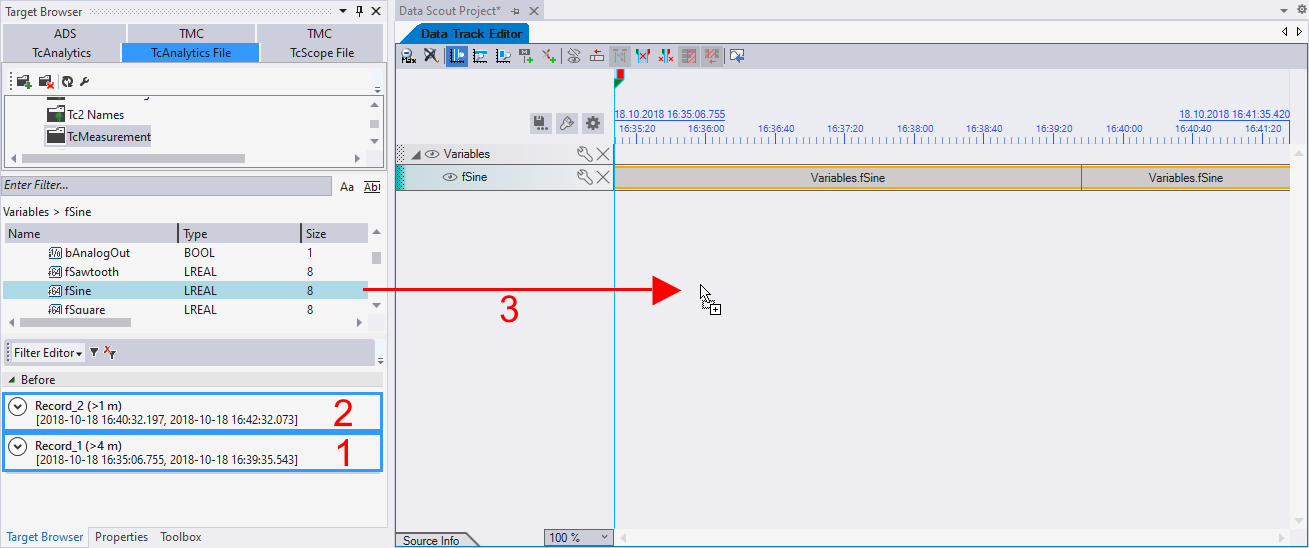
Add via drag and drop
The tracks of a Data Track Editor are displayed in a separate area. This is empty at the beginning and can be filled using the Target Browser.
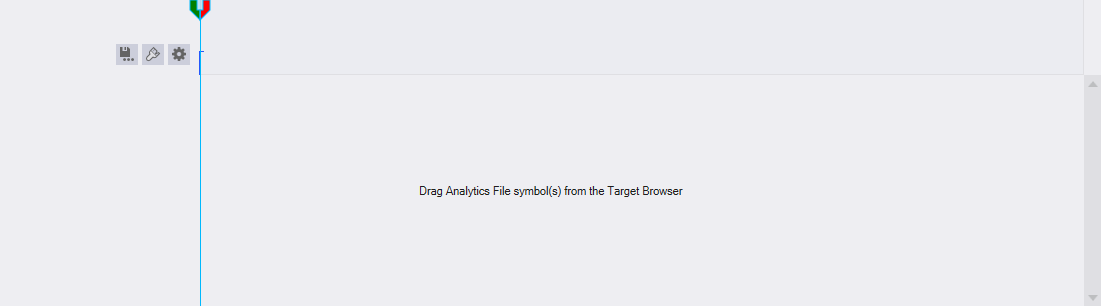
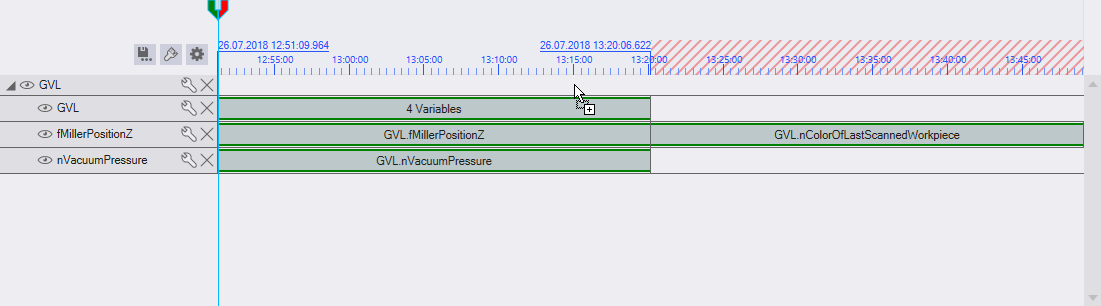
If one or more symbols are selected from the target browser and dragged into the empty area of the Track Editor, a new container track is created. To the new container track all selected symbols will be added as tracks.
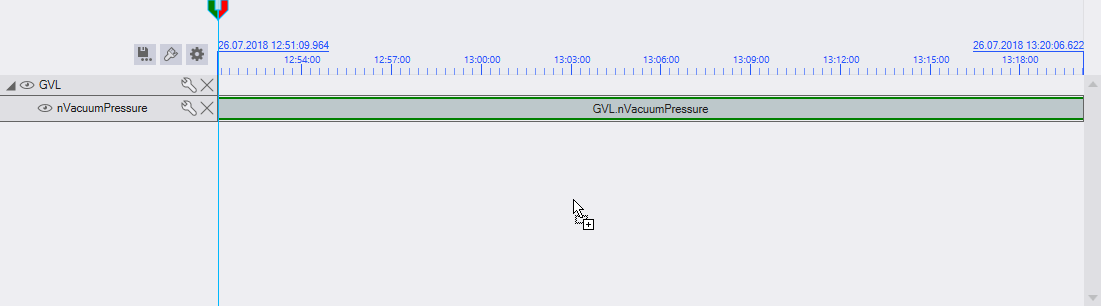
If a symbol is dragged and dropped onto the data area of a container track, a new track is created below this container.
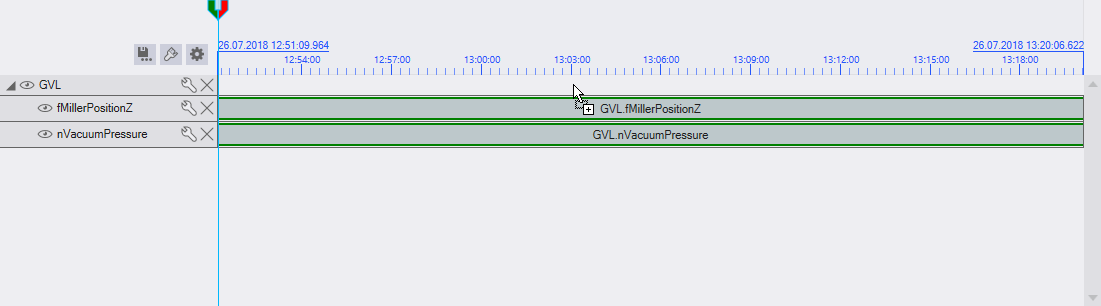
When dragging to a data track, a new data element can be added to that track. However, this is only possible if the symbol to be added is compatible with the track. No structure can be drawn on a track with primitive data types.
To create new multi-tracks you can drag to a container track or to the empty area while the [Ctrl] key is pressed.
If structures or arrays are to be added, this can happen as with symbols with primitive data type. However, tracks are created for the upper elements of structure tracks. And for arrays with a primitive base data type, an array track is created.
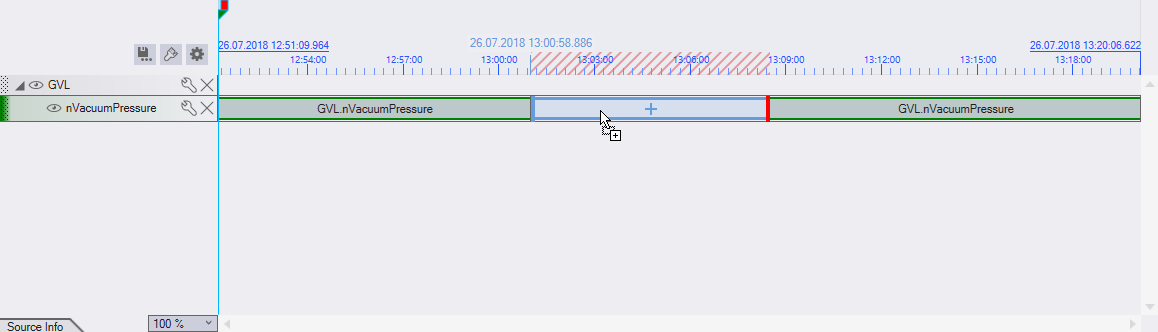
If you drag into a gap between two data elements and there is not enough space, the data element is cut off. This is indicated by a red line at the end of the preview. This allows a gap to be closed without the other elements shifting. If it is not to be cut off, it can be dragged directly over one of the two elements and inserted as normal.
Automatic merging
To combine symbols with the same structure, such as in an Analytics File with multiple records, when dragging and dropping multiple symbols onto a container or the empty area of the tracks, the system checks whether the symbols are the same. As soon as this is detected, a message appears that it is possible to add the symbols to the already existing tracks.
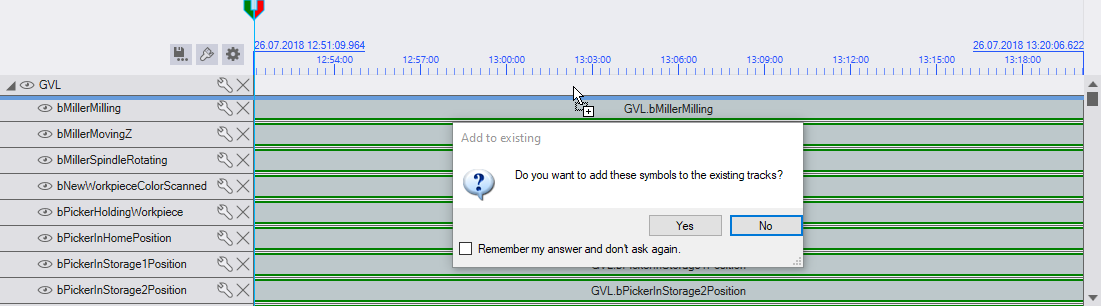
If this query is answered with Yes, the added symbols are added as data elements to the matching existing track. If the query is answered with No, new tracks are added.
The same result can be achieved by dragging each symbol individually onto the already existing track.
Insert Analytics File with multiple records
With the Target Browser, several records can be chosen at once and added to the Data Track Editor in one drag and drop. The records are added to the tracks as data elements in the order of their selection. The [Ctrl] and [Shift] keys can be used to select several records.
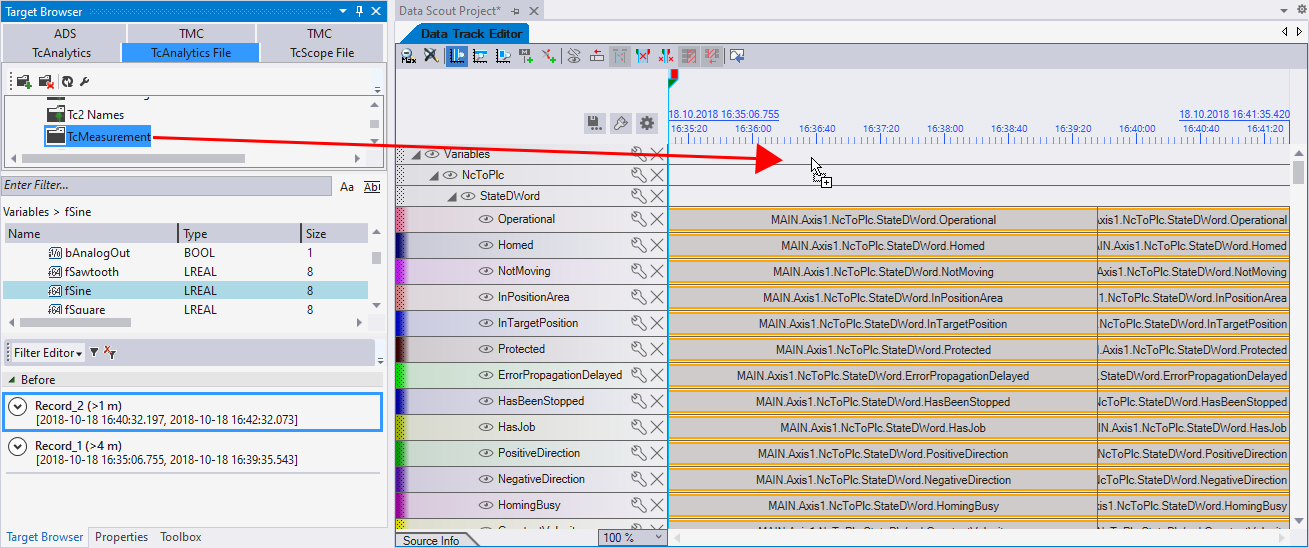
The entire Analytics File can also be added in one drag and drop. To do this, the folder must be dragged into the Track Editor in the Target Browser. All symbols and all records are then added as tracks, regardless of the selection in the target browser.
Change order
If the order of existing tracks or data elements is to be changed, this can be done with drag and drop. Data elements can be moved on the whole surface and tracks on the left border  . To do this, the area must be clicked with the left mouse button and moved with the mouse button pressed.
Data elements can be rearranged within the same track or moved to another track. When data elements are dragged onto container tracks or into the Track Editor, a new track is created. Also, the data element must be compatible with the track it is moved to e.g. a data element with multiple symbols from a multi-track cannot be moved to a single track. In some places, an attempt is made to align the data element with other data elements. This is indicated by a dashed line in the preview. If this is not desired, the Alt key can be held down to allow free movement.
Tracks can be rearranged below the container they are in or moved to another container. It is not possible to move tracks into containers that are inside the track to be moved or to move tracks that cannot be changed by their configuration or the configuration of the container above them, e.g. structure arrays.
Add via Target Browser Command
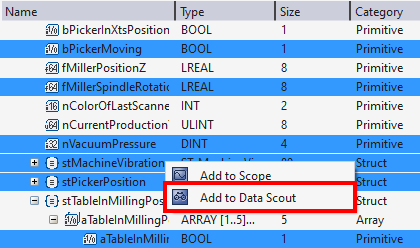
It is possible to add symbols from the target browser to a Track Editor by selecting the Add to Data Scout command from the context menu. The command is displayed when symbols compatible with the Track Editor are selected in the Target Browser and right-clicked. Tracks are then created for each symbol and the subsymbols of arrays and structures.
If no Data Scout Project exists, an attempt is made to create a new one. If there is already a Data Scout Project in the current Solution, the symbols will be added there. If a Track Editor is selected in the Solution Explorer, the symbols are inserted into it, otherwise a new one is created.