Manage dashboard structure and content in Analytics project
An Analytics project has a configuration of HMI contents (pages) and HMI controls (display elements) that are created during dashboard generation. This configuration can be viewed and changed via the Dashboard node in the Solution Explorer. You can rename the contents and controls at any time, move them to other contents via drag & drop, copy them (Ctrl-C, Ctrl-V) or delete them. A control can also be edited by double-clicking on it.
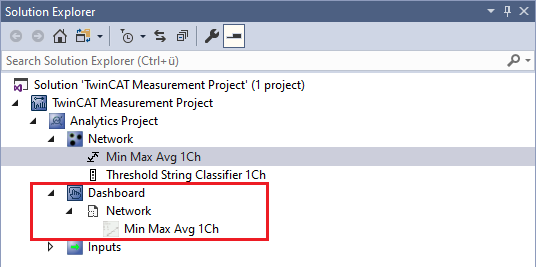
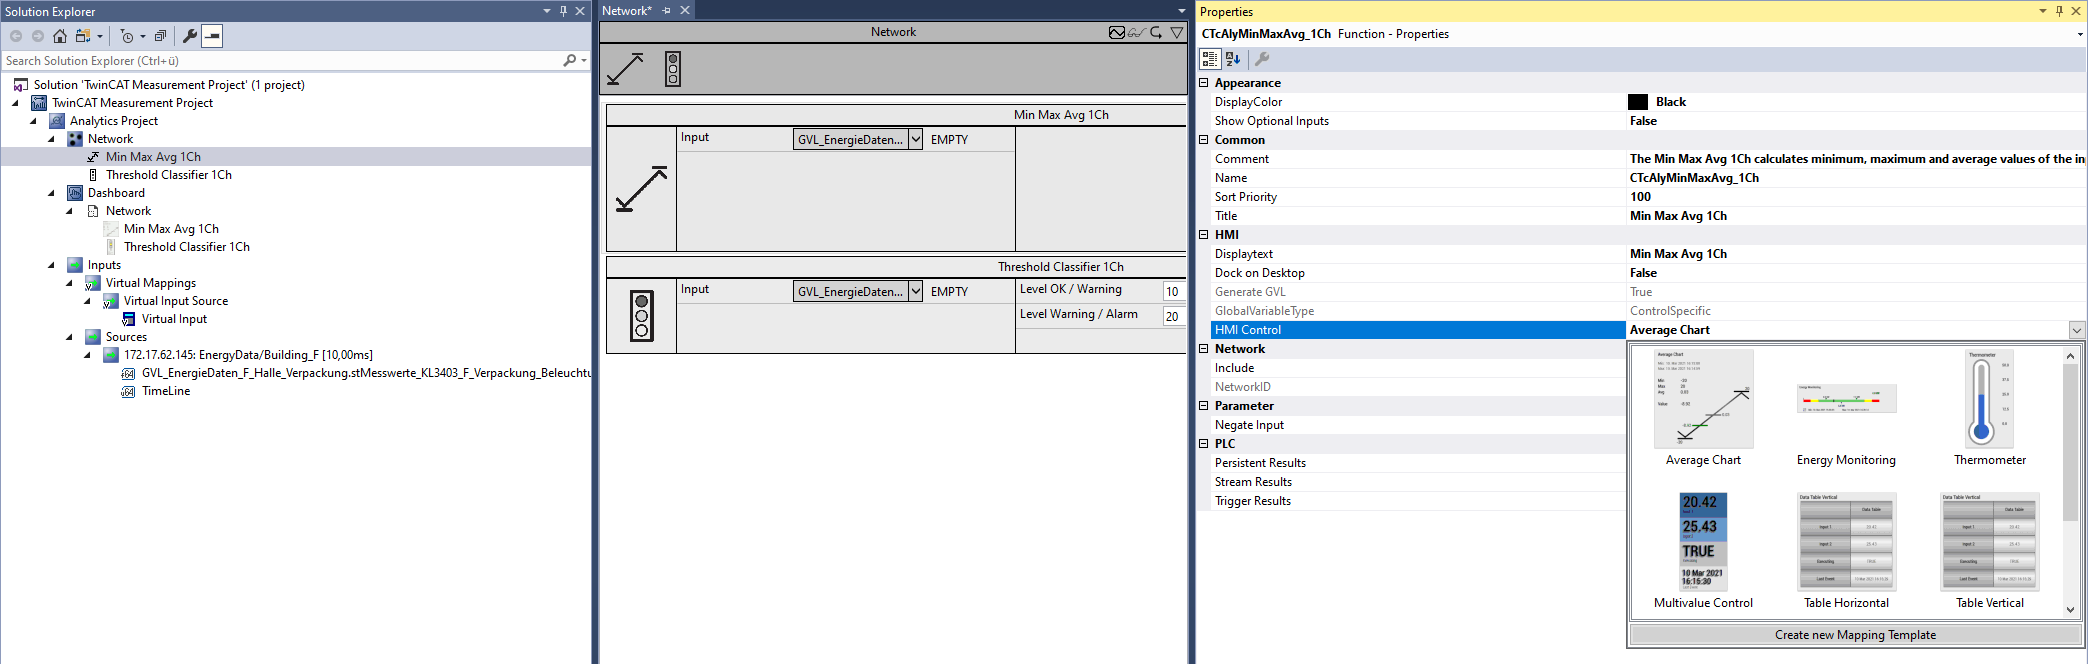
Each Analytics module has existing control mappings, which can be selected via the window Properties (you can also create/edit these yourself via "Create new Mapping Template" or via the Use customized and own controls (point 2)). Once a control is selected for a module, it is listed under the Dashboard node.
You can create new content for the Dashboard and Content nodes by right-clicking.
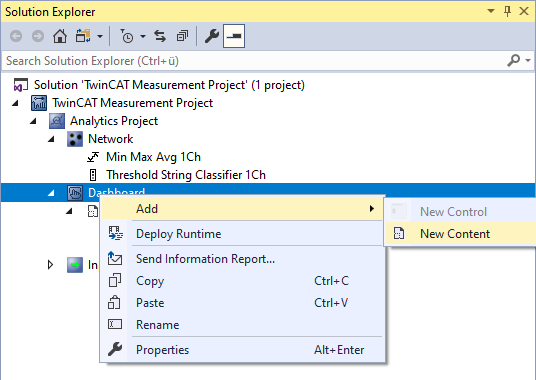
Likewise, you can add new controls by right-clicking on a Content node.
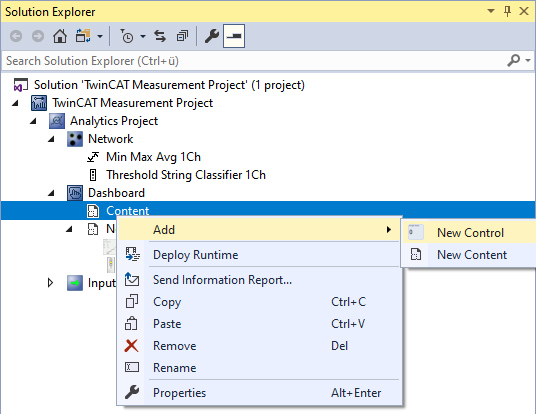
This opens the Analytics Dashboard Wizard. This wizard guides you step-by-step through the configuration for adding a control.
 | Analytics Dashboard Wizard Familiarize yourself with the wizard by adding a control (select a control from the Properties window of the module). You can then look up the entire configuration in the wizard by double-clicking on the control. There you can follow the individual configuration steps. |
Analytics Dashboard Wizard
Select a control. All available controls are listed on the left. By default, only controls that are not algorithm-specific are listed. All controls can be made available by unchecking the Show only default Controls checkbox.
- 1. Select Single Value to display a single value in the dashboard. Click the Next button to continue.

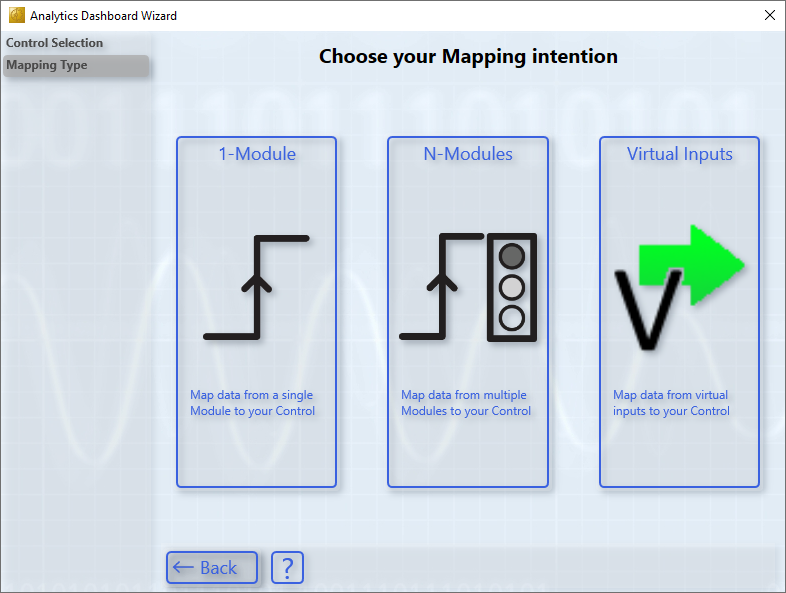
- 2. You can now link data from one module (1-Module), several modules (N-Modules) or from virtual inputs (Virtual Inputs). For this example, select 1-Module.
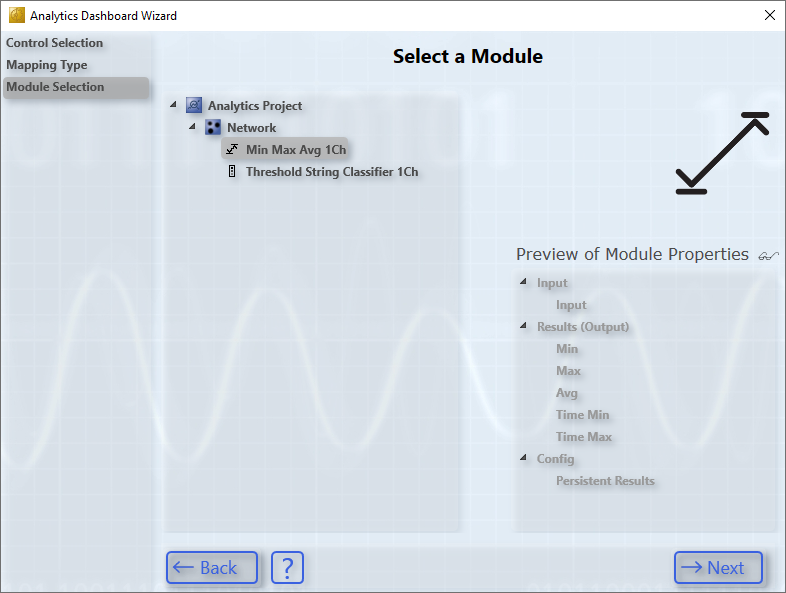
- 3. All modules from the Analytics project are listed. Select the module from which you want to display the data. A preview of the selected module is available on the right.
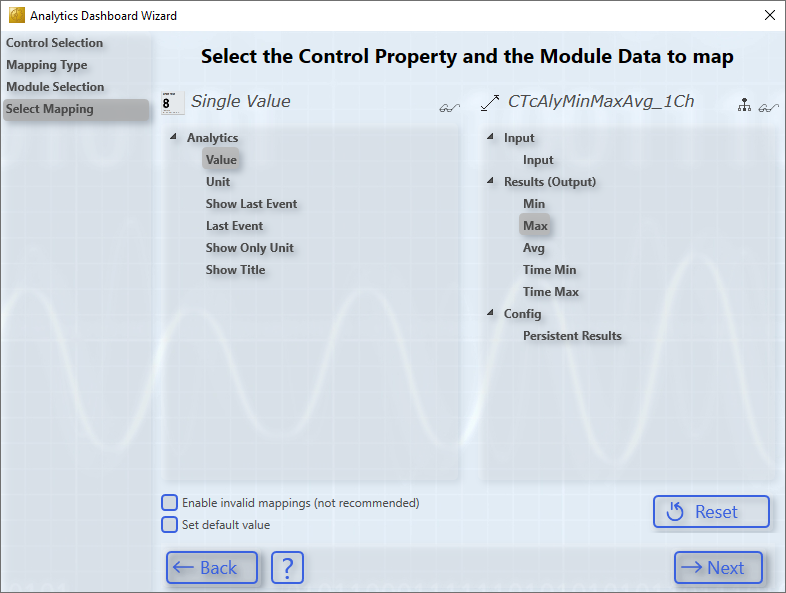
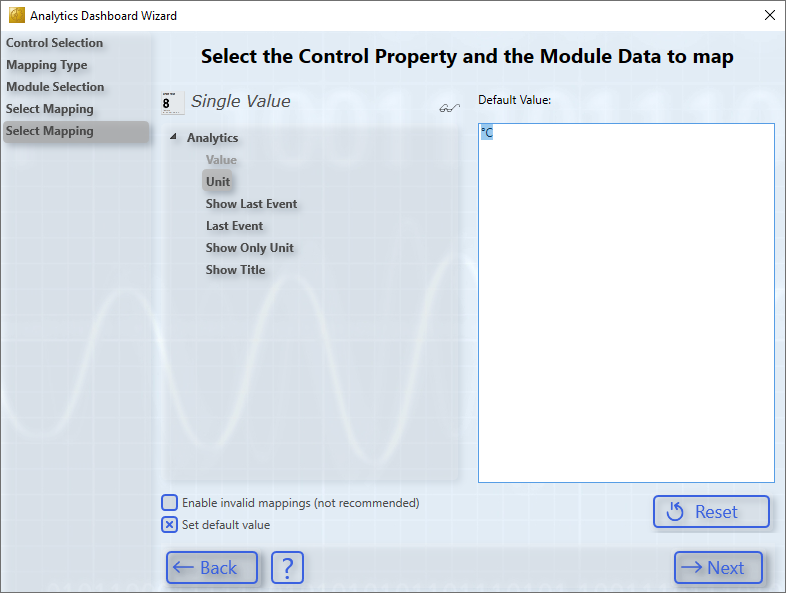
- 4. Here the first control property is linked to a module variable. To do this, select the Value to be displayed with the variable Max.
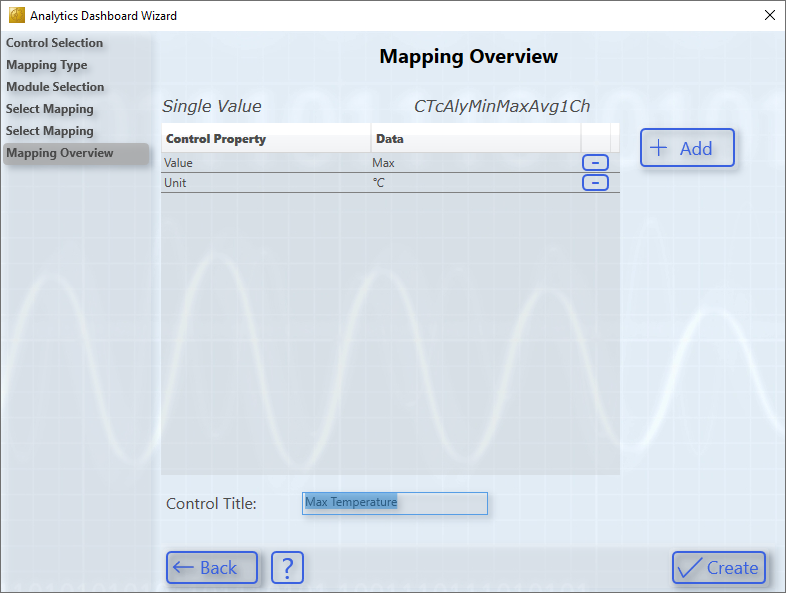
- 5. This overview page lists all existing links. Add another link with Add.

- 6. Select Unit and check Set default value to assign a static value. A text field opens on the right; enter °C.
- 7. Change the title of the control to Max Temperature and add the control mapping via Create.
- 8. The Max Temperature control that was created appears in the Dashboard node. Right-click > Rename to rename the content.
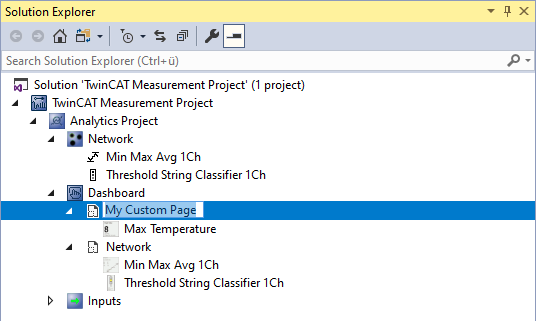
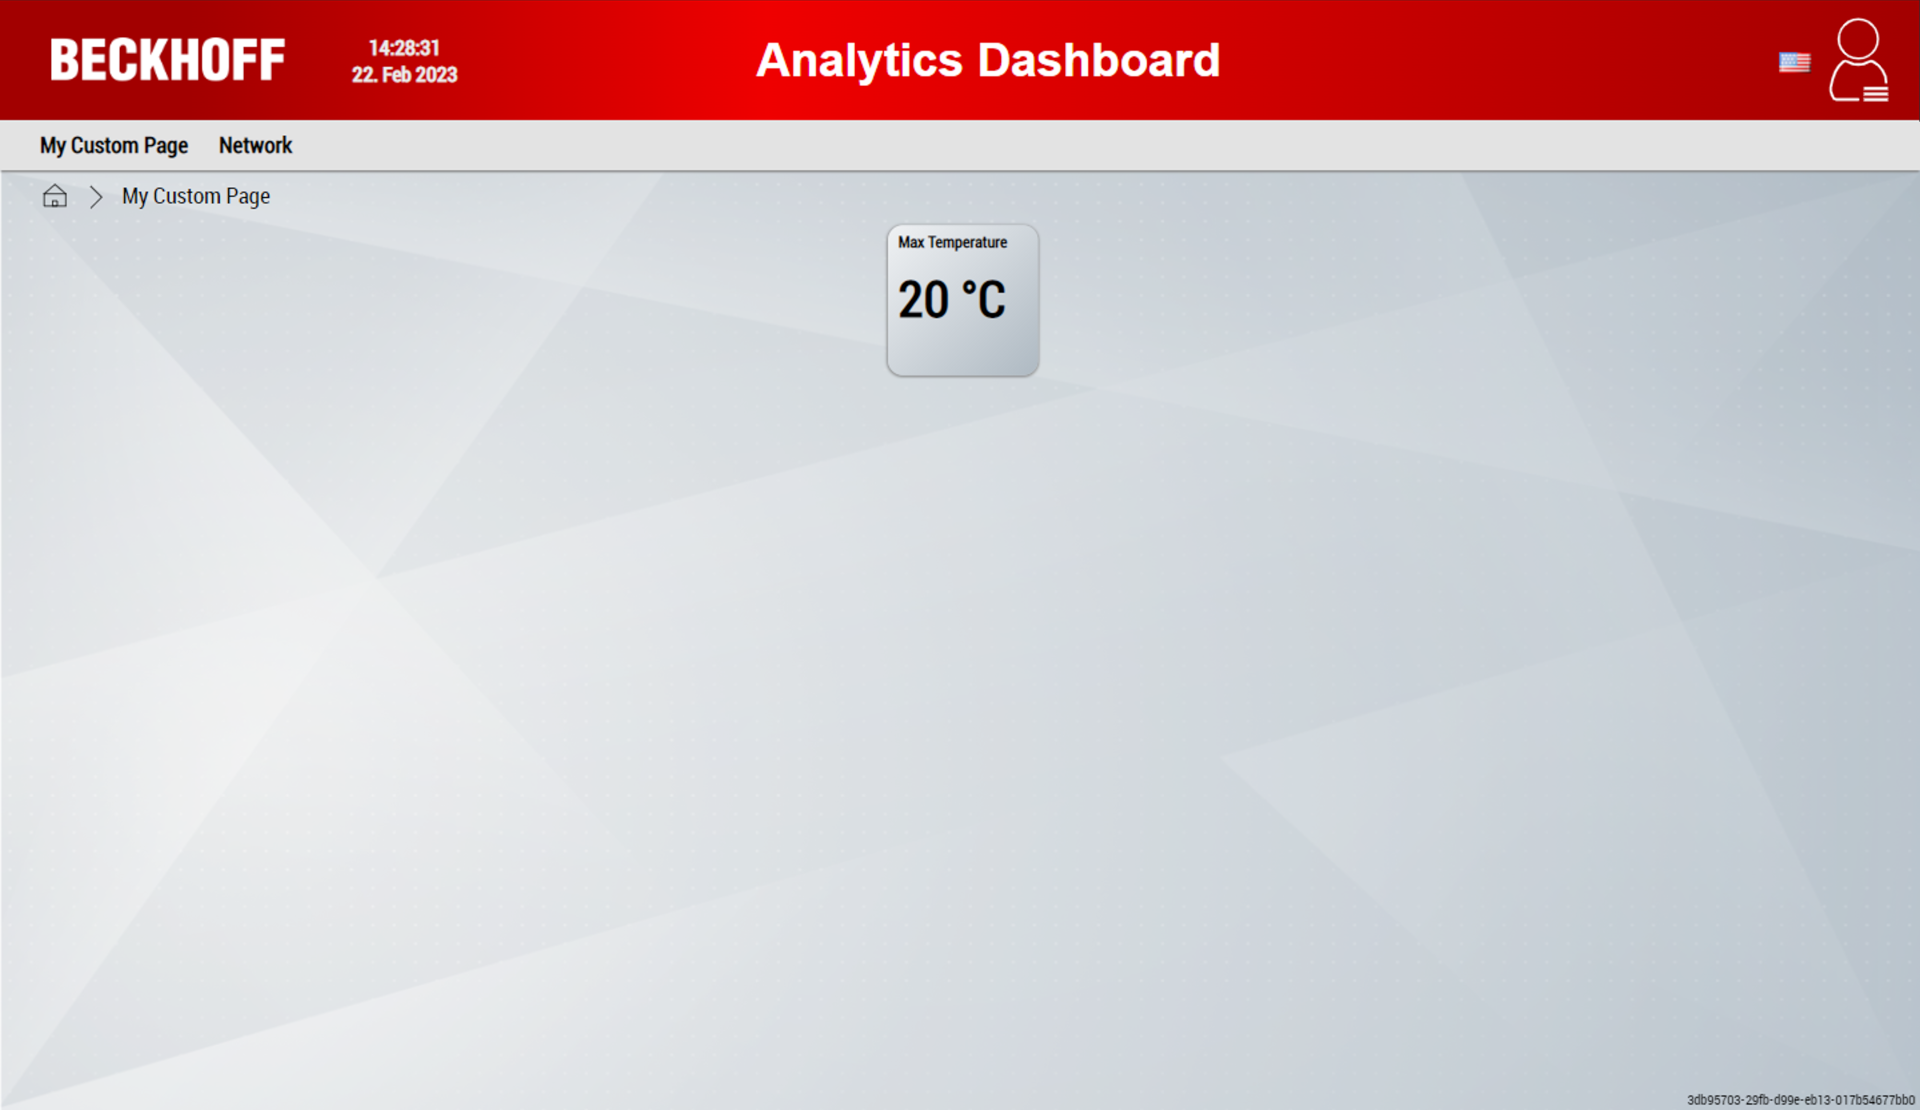
- After a successful HMI and PLC generation, you can open the previously created My Custom Page via the navigation. There you can see the manually created control.