Quick start
To start, create or open a TwinCAT HMI project.
Installation
Install the NuGet package "Beckhoff.TwinCAT.HMI.SqliteHistorize" via the NuGet Package Manager.
Adding a symbol in Visual Studio / TcXaeShell
- Open the TwinCAT HMI Configuration window.
- 1. Go to the Server Symbols / Mapped Symbols tab.
- 2. Select the symbols to be added to the Historized data.
- 3. Right-click on New Historize Settings to add Historize data to the configuration.
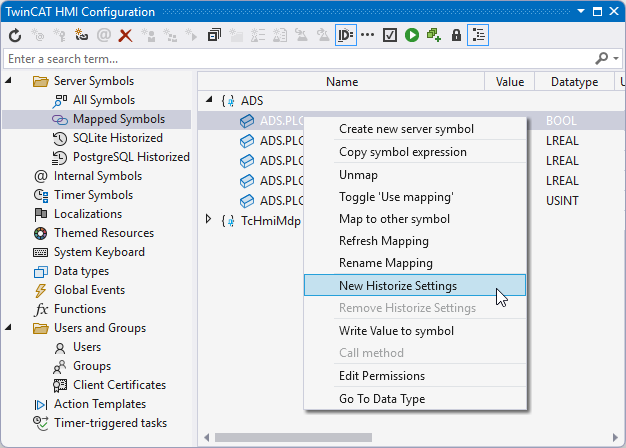
- A pop-up opens for further settings.
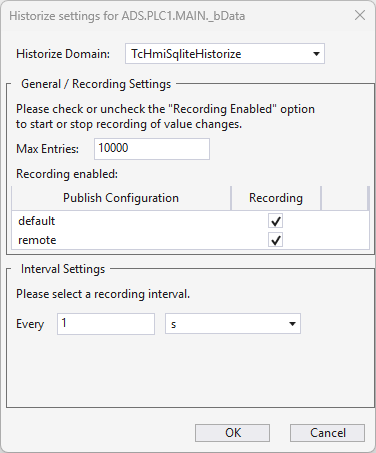
- 4. Check the Historize Domain (TcHmiSqliteHistorized).
- 5. Define under:
Max Entries the maximum number of values for this symbol to be saved in the database.
recording interval at which new values are transferred to the database.
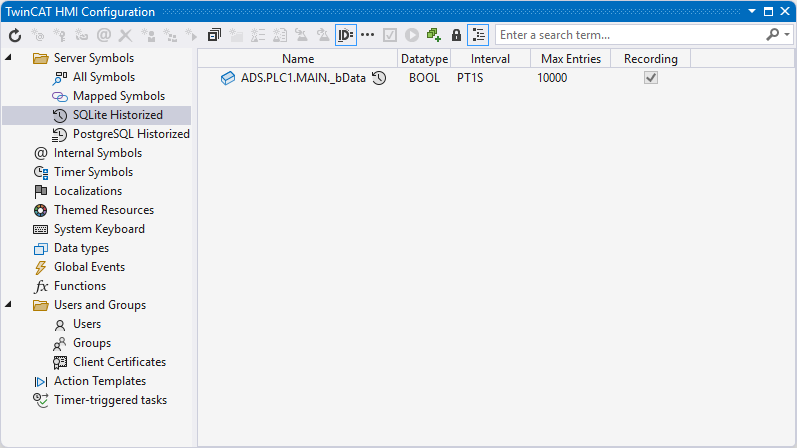
- The symbols you have configured are now included with the corresponding configuration. An overview of all configured symbols can be found under Server Symbols /SQLite Historized.
Adding a symbol via the server configuration page
- 1. Open the server configuration page.
- 2. Go to the TcHmiSqliteHistorize tab.
- 3. Go to Historized symbols.
- All currently configured symbols are displayed here.
- 4. Click on Add symbol.
- A pop-up opens for further settings.
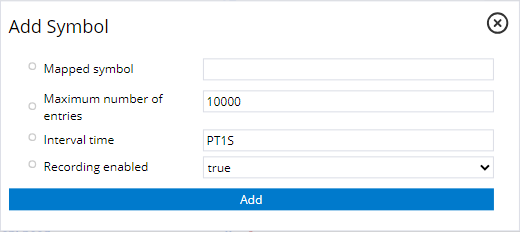
- 5. Define under:
Symbol-Mapping, the name of the corresponding symbol.
Maximum number of entries how many values of this symbol should be stored in the database.
Interval time at which new values are transferred to the database.
Recording enabled whether the configured symbol should currently be recorded.
- The symbols you have configured are now available in the Historize extension and can be written to the database with the corresponding intervals.
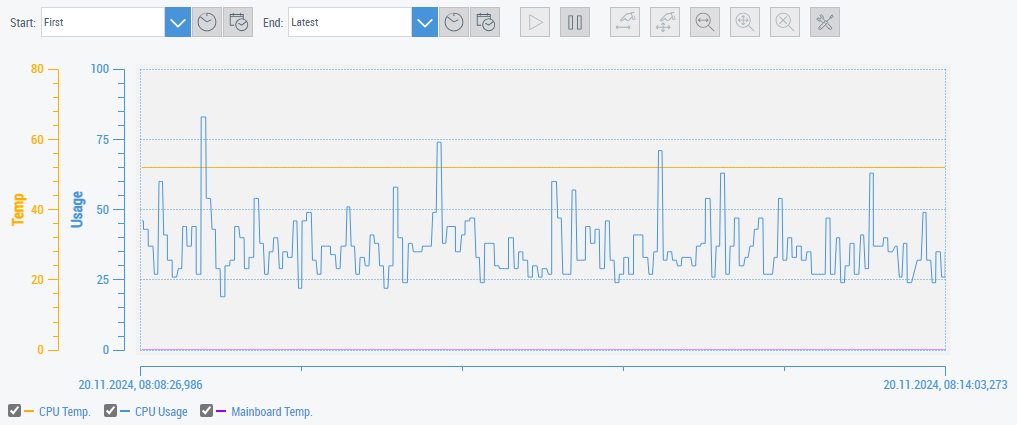
Include the control to display the values in a line chart.
- 1. Add the TrendLineChart to a View or Content page.
- 2. Check under Common /
- 3. Go to Line Graph Description in the properties window.
- 4. Create a new element:
Choose the desired symbol.
Select an Axis ID.
- Start the Live View. If the configuration is successful, the symbol is displayed as a Line in the graph.
Example with two Y-axes and three symbols.