Example 3
The procedure for creating a motion diagram is illustrated again in this next simple example.
The task:
The following slave motion is to be implemented for a rotation of the master axes from 0 to 360 degrees.
- A velocity of -0.2 (normalized) from master position 140 to 240 and from slave position 10.
- The motion has no rest.
- In the tree structure, create a master and its corresponding slave via MOTION > Tables (see Introduction).
- After selecting Slave 1 in the tree structure, both the graphic window and the table window appear.
- In the graphic window, click the approximate positions of the points in the window using the Insert Point command.
The corresponding values will then be inserted into the table window.
- To turn the motion plan into a motion diagram, you now need to add some information.
- For the second section we use the Synchronous Function command to specify, by clicking with the mouse inside that section, that a linear movement is to be used there. In the first and third sections, the Automatic Function command is used to implement automatic adaptation to the boundary conditions.
- You can now use the move commands to manipulate the position of the points.
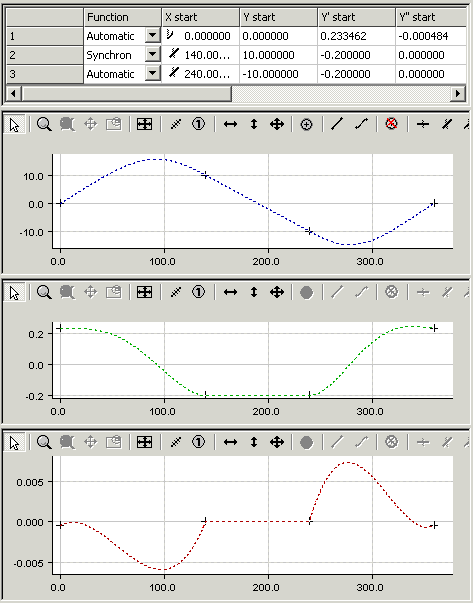
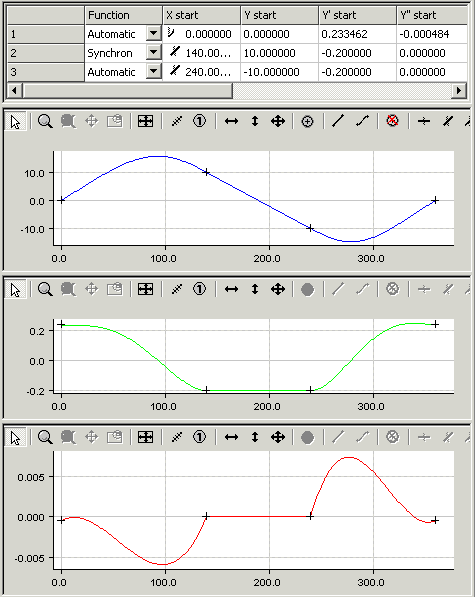
By right-clicking and selecting Select Graph 3 View, the velocity in the second graph window and the acceleration in the third graph window are displayed in addition to the slave position in the first graph window.
The fact that it is a rotary axis is specified in the master's properties. Because the start position corresponds to the master's minimum, and the end position corresponds to its maximum, the first and second derivatives at the end of the diagram are set equal to those at the beginning. It is still possible to adjust the velocity and acceleration at the beginning interactively (vertical shifting) in their windows.
- Save the data.
- Activate the configuration.
- Restart TwinCAT 3.
The online data can now be displayed by right-clicking and selecting Select Graph 2 View.
They are displayed as a dotted line in the same color.