Debugging
The following step-by-step instructions apply to the use of both TcCOM objects and function blocks created using the Target for MATLAB®. The following shows the debugging for a PLC function block.
- Step-by-step procedure:
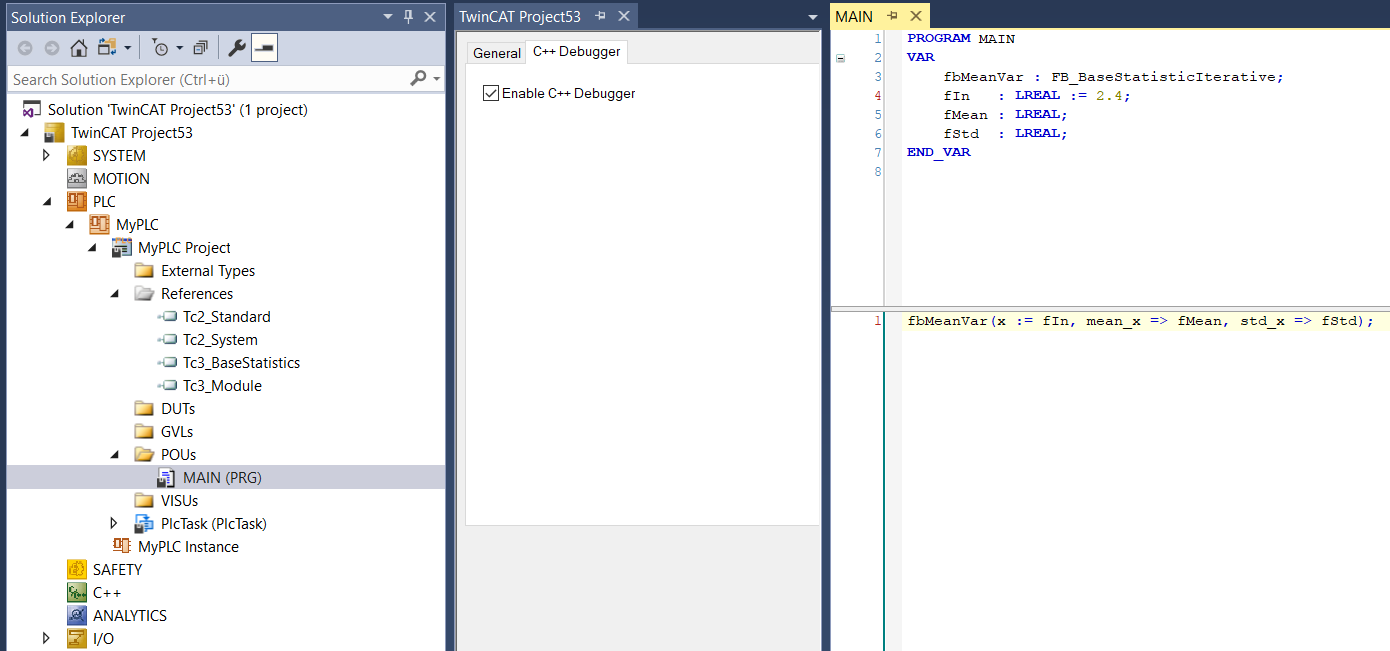
- 1. Make sure that your TwinCAT application has been activated with the C++ debugger enabled.
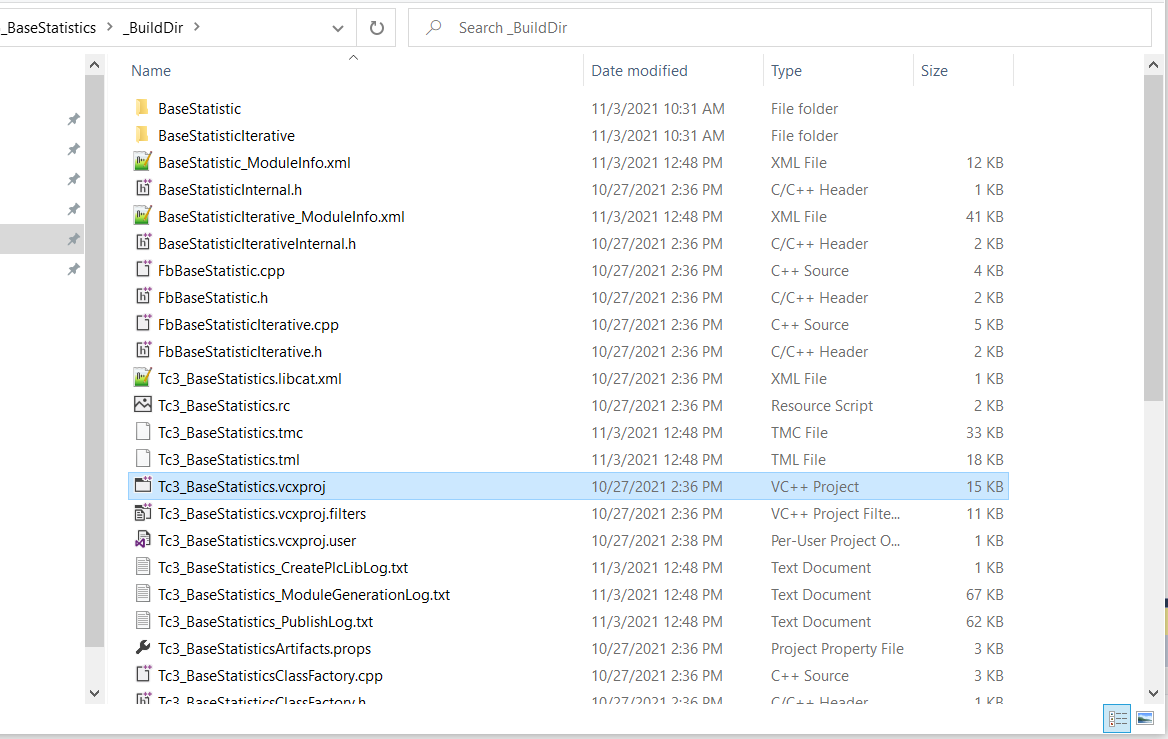
- 2. Open the TwinCAT C++ project created during code generation that belongs to the module you want to debug.
- You specified the project location when initializing the project export configuration, see Generated Code TE1401.
- You can open the Visual Studio project directly or add it to your TwinCAT solution under C++ with “Add existing Item”.
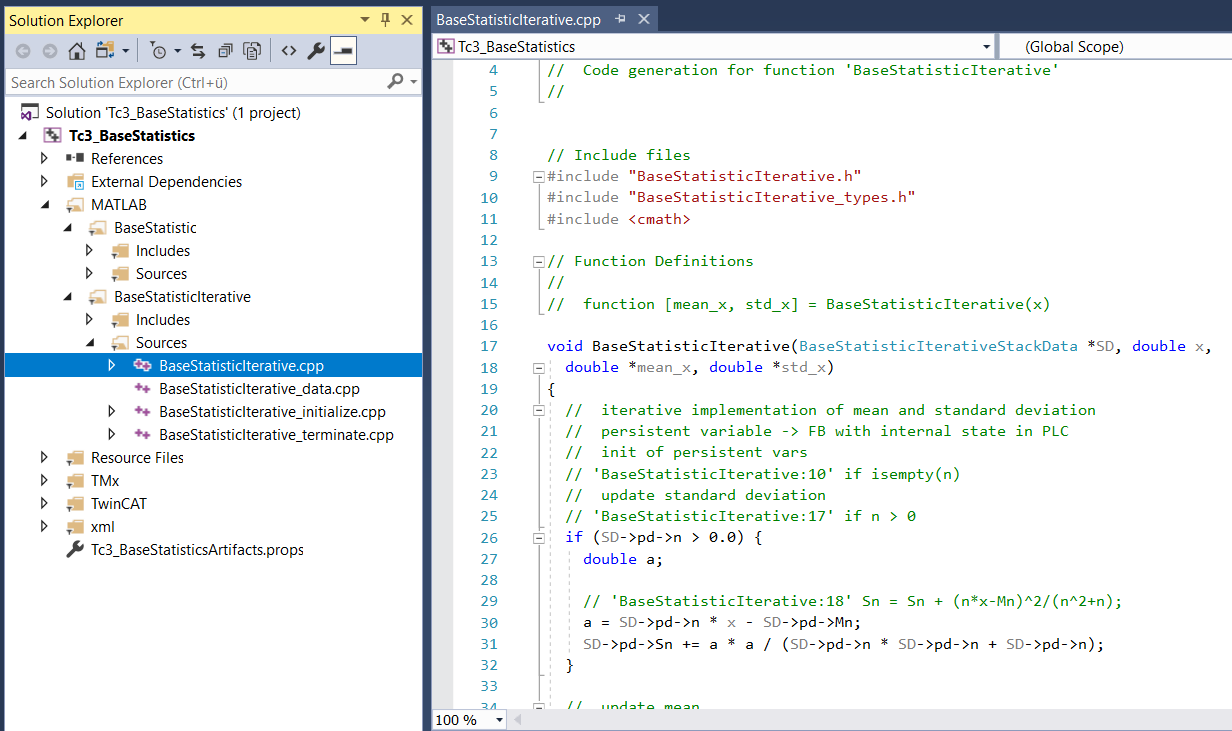
- 3. In the MATLAB® folder in the Visual Studio solution, view the subfolders that bear the name of the MATLAB® function created.
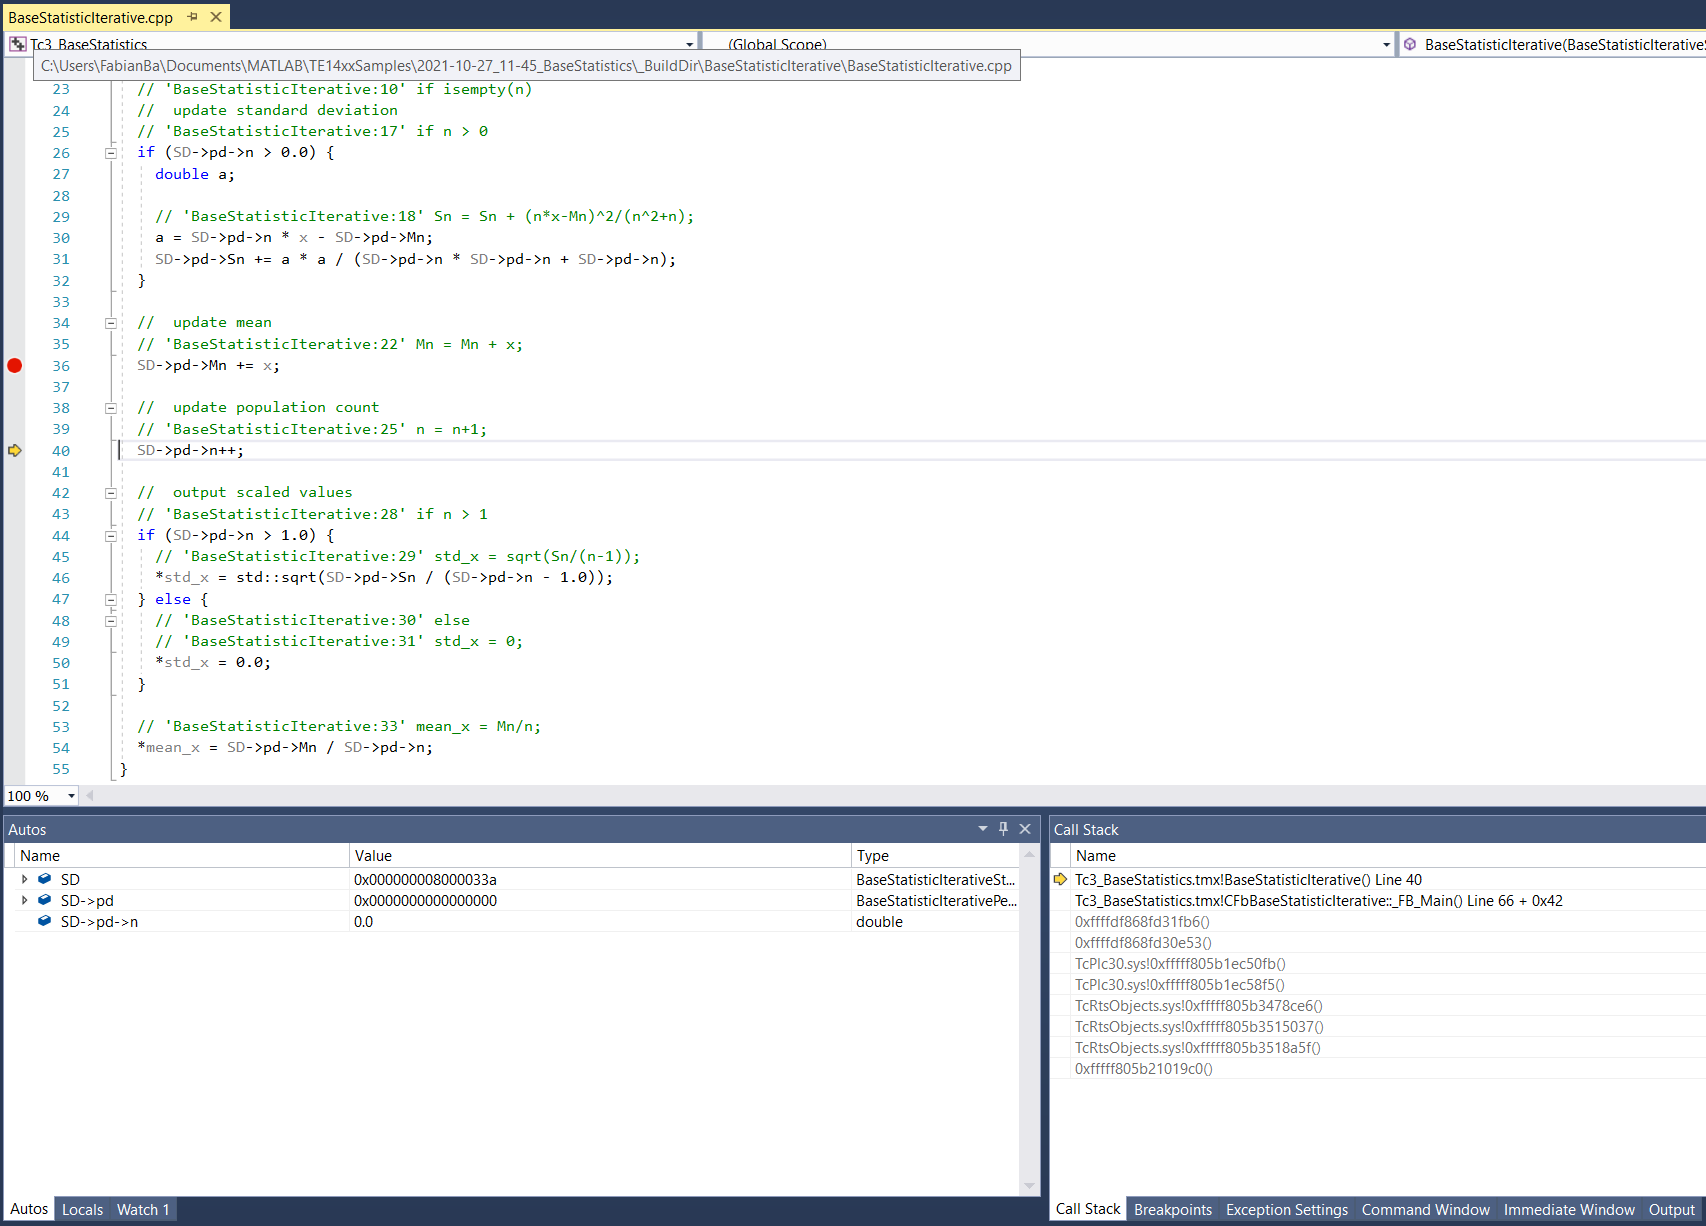
- In the Sources sub-folder, you can find the executed code generated by MATLAB® Coder™.
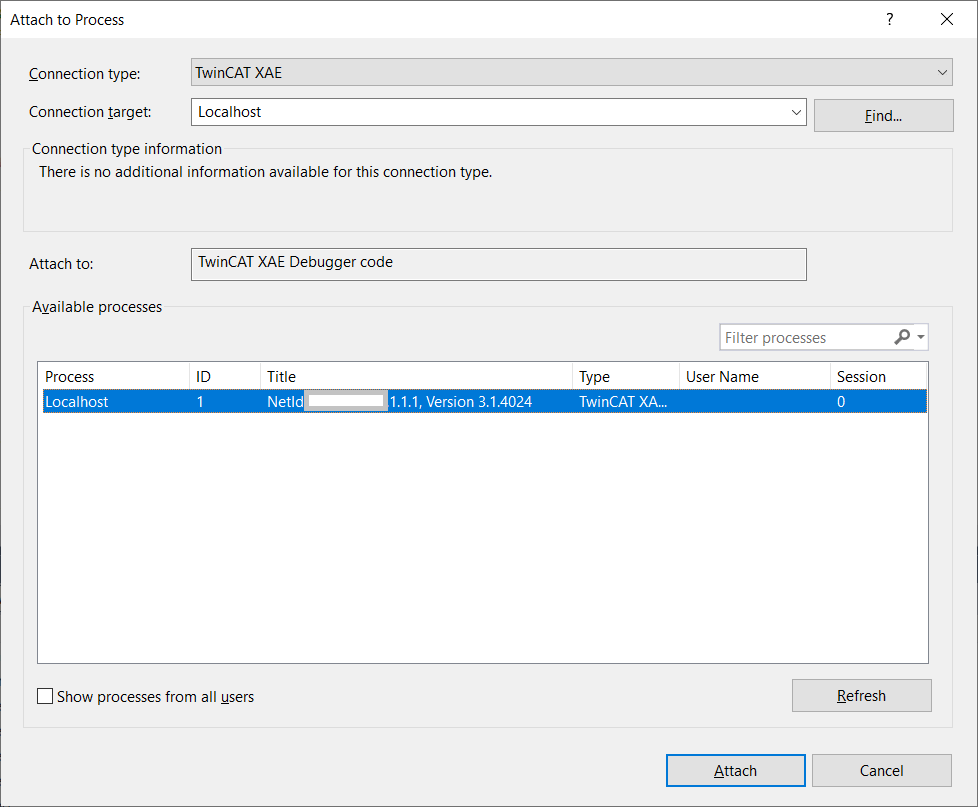
- 4. Select Debug > Attach to Process in the menu bar, select “TwinCAT XAE” as the Connection Type, and the desired target system under Connection target. Then select Attach.
- 5. Set breakpoints in your C++ code and step through your code as usual.