Debug
Different ways are available to find errors within a TcCOM module created with MATLAB®/Simulink®, or to analyze the behavior of the module within the overall architecture of the TwinCAT project.
Debugging in the block diagram
If the block diagram was exported during generation of the TcCOM module, it can be displayed in the TwinCAT development environment and used for debugging within the corresponding module instance, for example. To do so, the block diagram uses the Microsoft Visual Studio debugger, which can be linked with the TwinCAT runtime via the TwinCAT debugger port. Attach the debugger as described in the C++ section under Debugging.
Prerequisites for debugging within the block diagram are:
- The C/C++ source code of the TcCOM module must be present on the engineering systems, and the Visual Studio debugger must be able to find it. Ideally, debugging should take place on the system on which the code was generated. If the module was created on another system, the associated C/C++ source code can usually be made known by integrating the Visual Studio project into the TwinCAT C++ section. The file <ModelName>.vcxproj is located in the build directory, see Which files are created automatically during code generation and publishing?
- The module must have been created with the Debug configuration. When publishing takes place directly after the code generation, select the Debug setting in the Module generation (Tc Build) section under publish configuration. When publishing the module from the C++ section in TwinCAT, the debugger in the C++ node of the solution must be enabled; see C/C++ documentation, Debugging.
- During code generation, the options Export block diagram and Export block diagram debug information must be enabled in the coder settings under Tc Advanced.
- In the TwinCAT project, the debugger port must be enabled, as described in TwinCAT 3 C++ Enable C++ debugger.
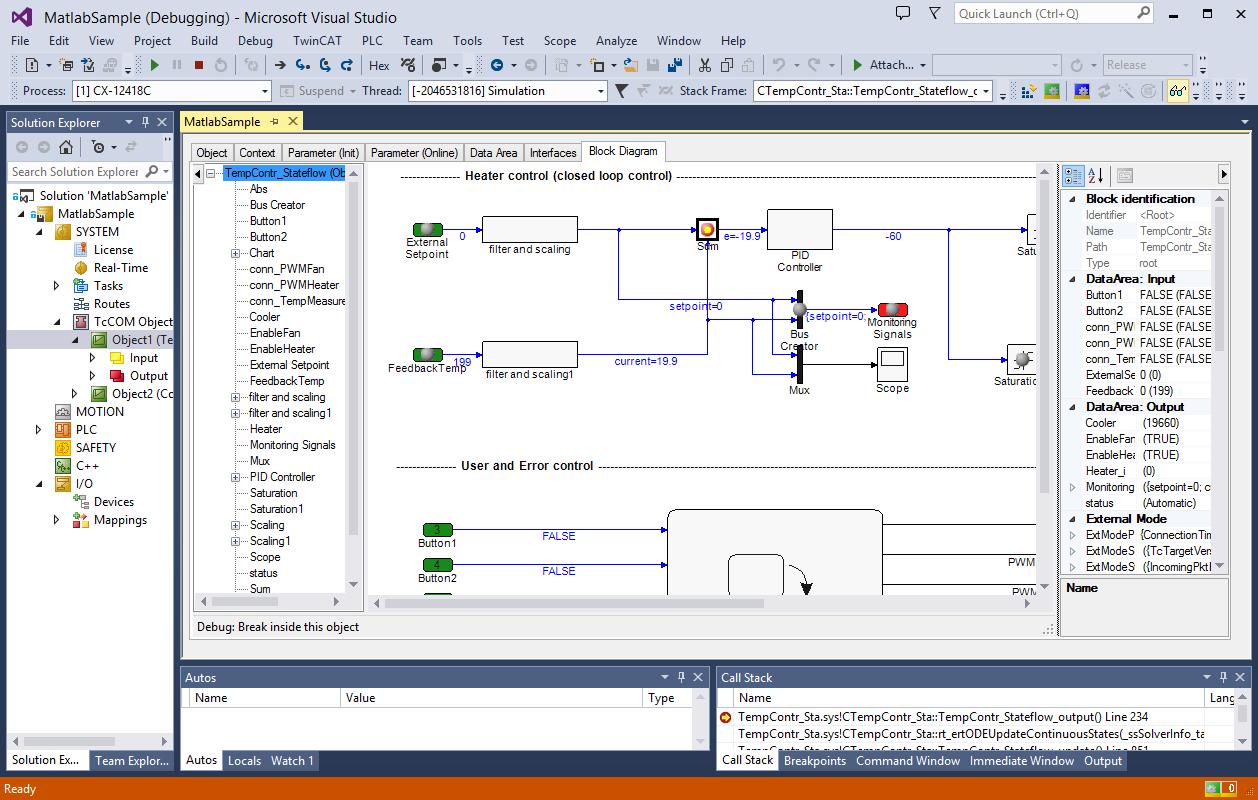
Setting breakpoints in the block diagram
- 1. After attaching the debugger to the TwinCAT runtime, the possible breakpoints are assigned to the blocks in the block diagram and represented as points. Clicking on the desired breakpoint activates it, so that execution of the module instance is stopped next time the associated function block is executed. The color of the point provides information about the current state of the breakpoint:
- Gray: breakpoint inactive
- Red: breakpoint active. The program is stopped next time this function block is executed
- Yellow dot in the middle: breakpoint hit. Program execution is currently stopped at this point
- Blue dot in the middle: breakpoint hit (as yellow), but in a different instance of the module.
- 2. Additional information, such as the corresponding C++ code section, can be found in the tooltip for the breakpoint:
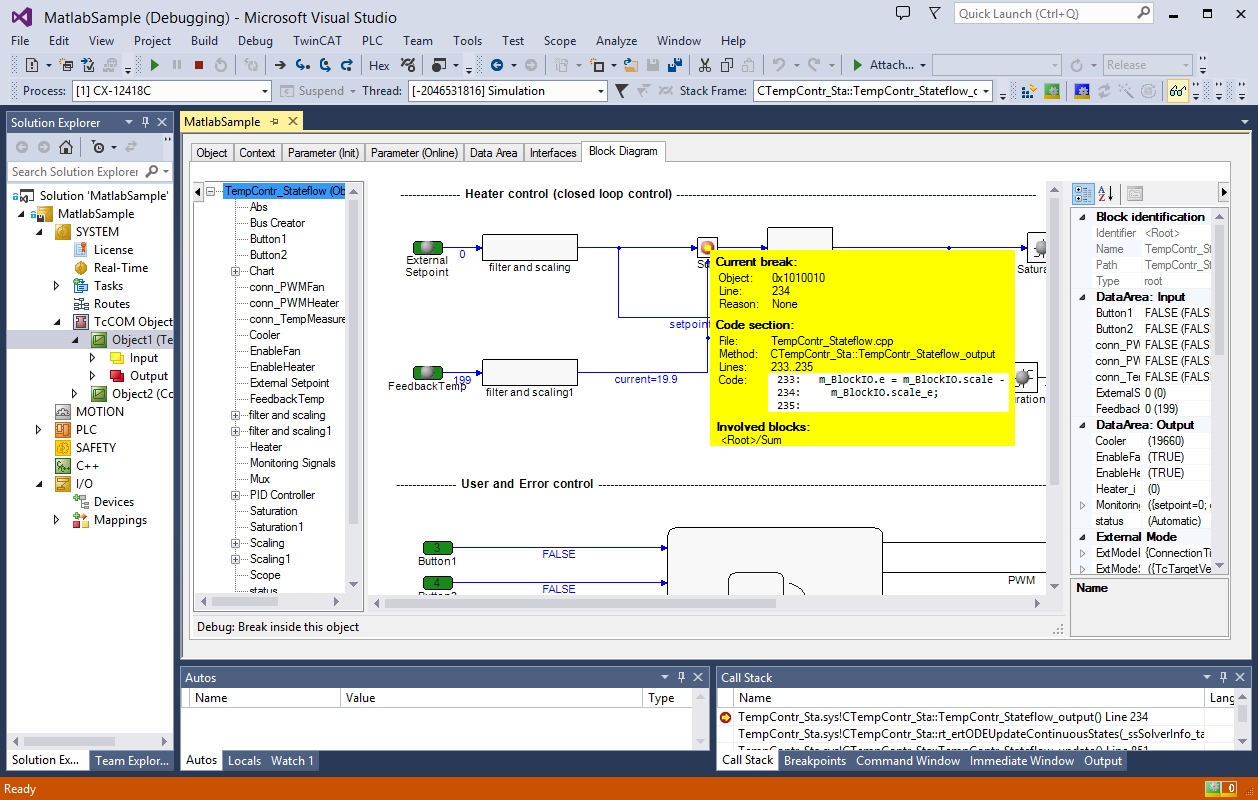
 | Breakpoints are not always assigned to a single function block. In many cases, the functions of several blocks are consolidated in a code section or even a line in the underlying C++ code. This means that several blocks can share the same breakpoint. Therefore, activation of a breakpoint in the block diagram may also result in changes in the point display in other blocks. |
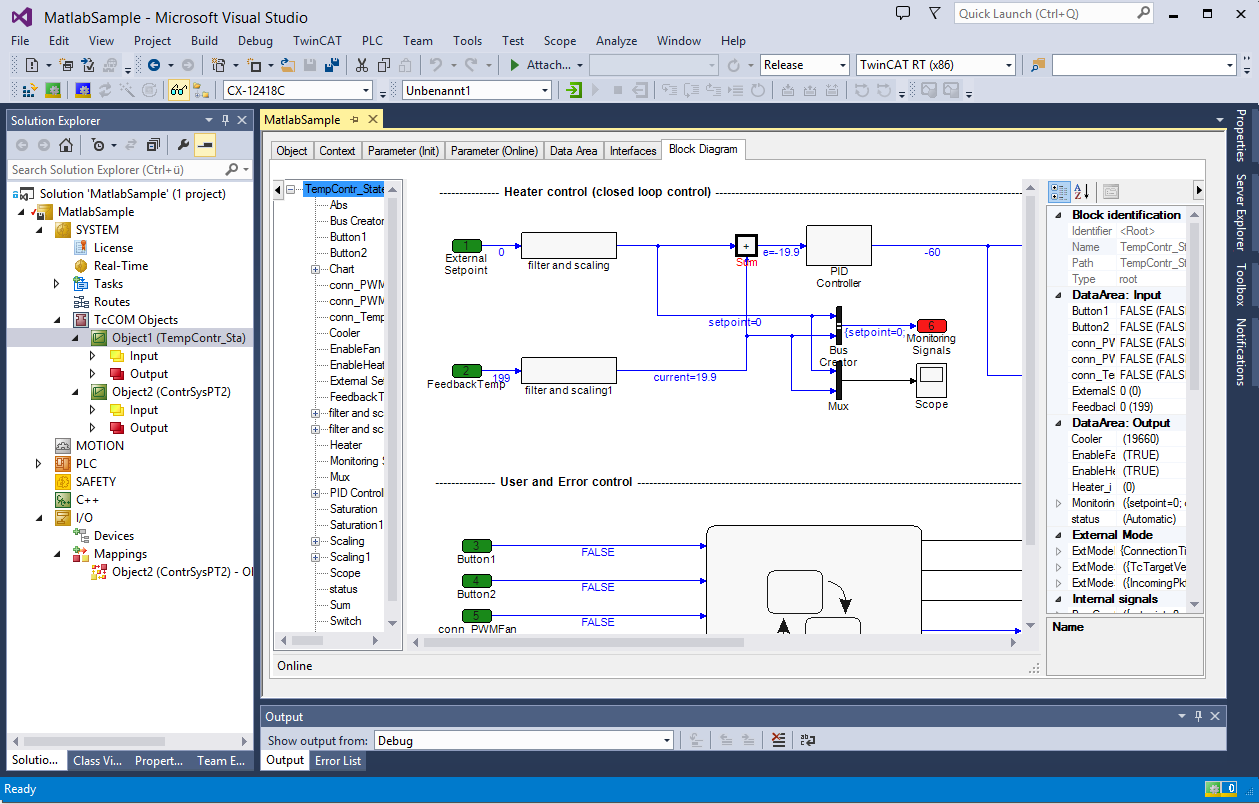
Evaluating exceptions
If exceptions occur during processing of a TcCOM module, such as division by zero, the point at which the exception occurred can be shown in the block diagram. To this end, the TcCOM module must meet the above requirements, and the C++ debugger must be enabled in the TwinCAT project (TwinCAT 3 C++ Enable C++ debugger). After the debugger has been attached, which may be done before the exception has occurred or indeed after, the block that caused the exception is highlighted in the block diagram, provided the line of code responsible for the exception can be allocated to a block. The name of the function block is shown in red, and the function block itself is marked in bold.
Manual evaluation of exceptions without source code
Even if the module source code is not available on the engineering system or the C++ debugger was not activated, you can highlight the error location in the block diagram once an exception has occurred.
Typically, an error message will always be generated when an error occurs, indicating the source file and the line in the source code. In many cases, this information can be used to allocate an exception to a block in the block diagram. To do this, you can proceed as follows:
- A prerequisite for highlighting the error location within the block diagram is that debug information was generated (option Export block diagram debug information in the coder settings under Tc Advanced).
- 3. From the context menu of the block diagram select the entry Provide exception data:
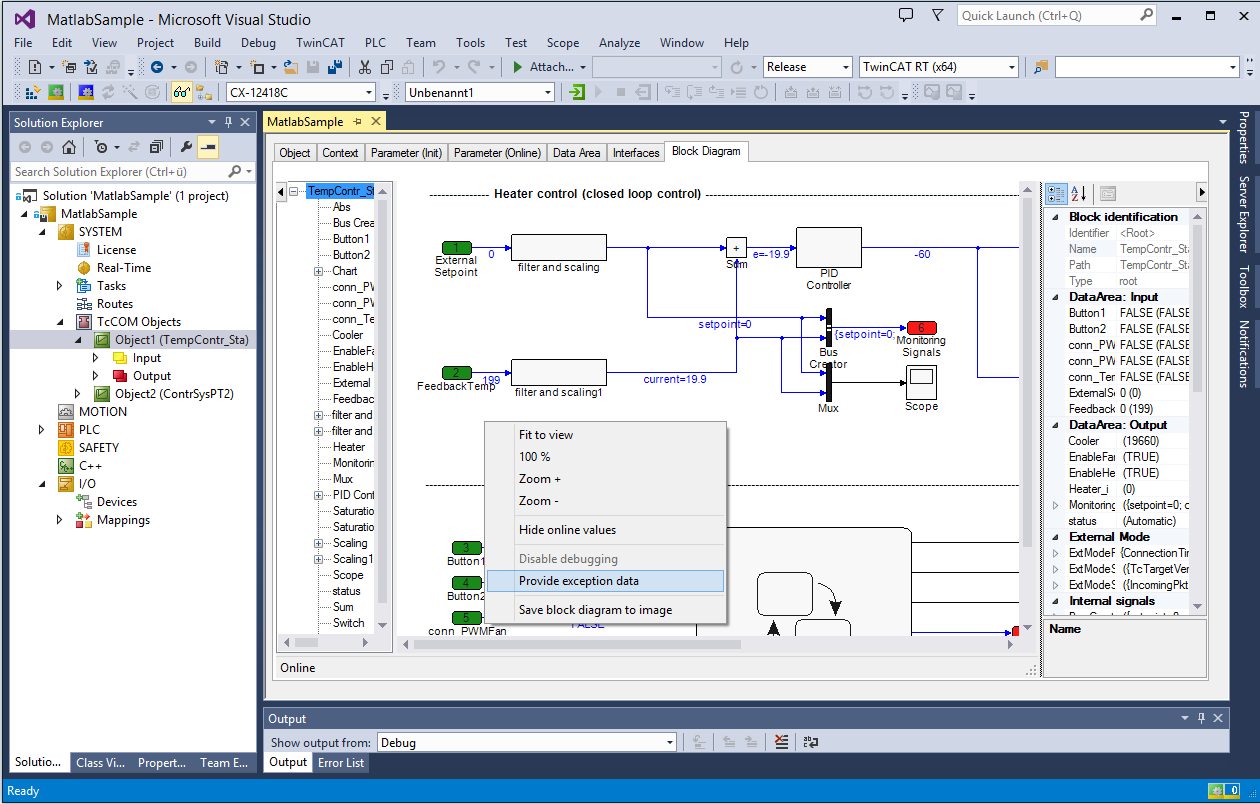
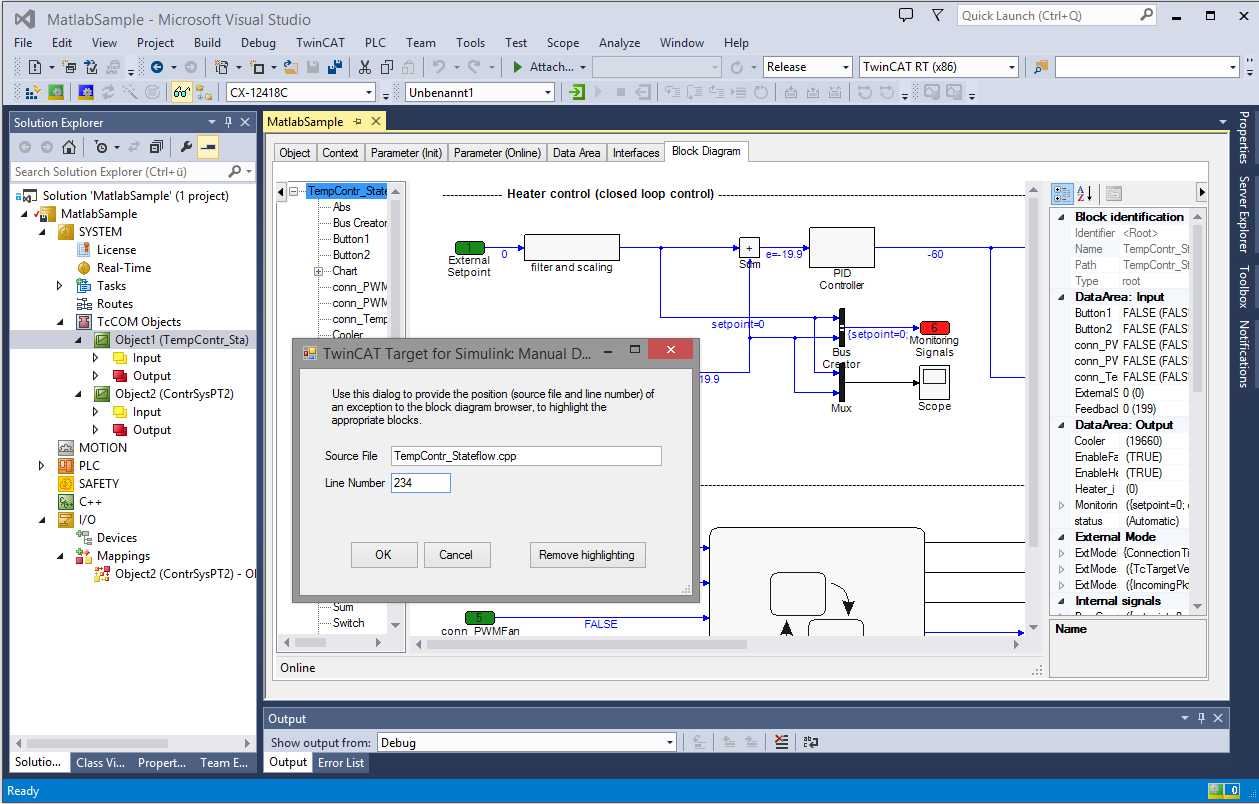
- 4. In the dialog that opens, enter the source code file and line number provided in the error message:
- 5. The name of the function block associated with the line number is displayed in red, and the function block itself is marked in bold: