Display signal curves
For verification and troubleshooting it is often helpful to display signal curves. The block diagram offers the following options:
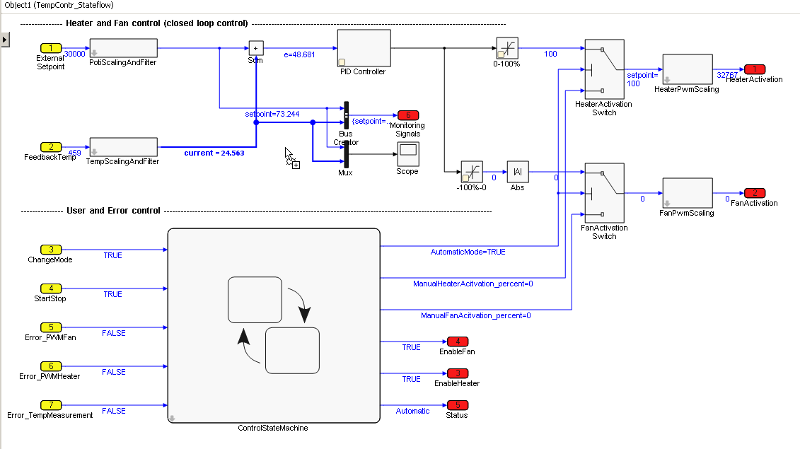
Display signal curves in the block diagram
The block diagram offers an option to display signal curves in a window. To this end, drag and drop a signal or block into a free area of the block diagram.
Create a scope in the block diagram
After the drop, a scope window opens in the block diagram.
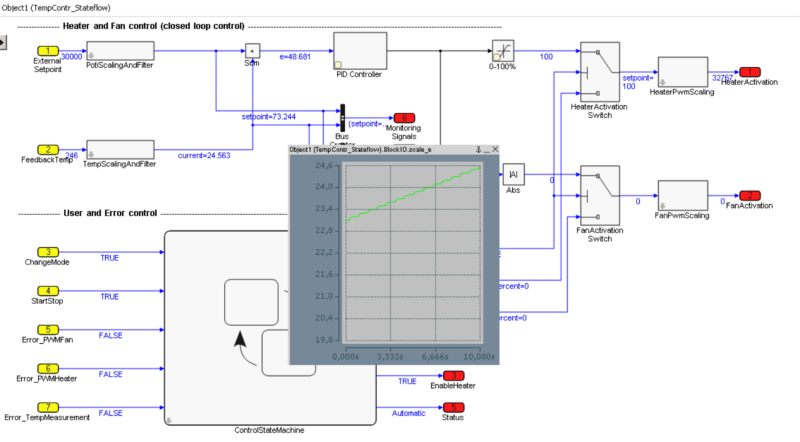
Display the scope in the block diagram
The title bar of the scope window offers the following options:
| Close window |
| Keep window in the foreground across all block diagram hierarchies |
| Minimize window to the title bar |


 | Displaying the scope in the block diagram control requires a Scope View Professional (TE1300) license. No Scope View Professional license is required in TwinCAT XAE. |
When creating a scope window in the block diagram for a Simulink® bus, all signals of the bus are directly displayed in the scope window.
The scope window in the block diagram can be used for a quick overview. For more detailed analyzes, it is advisable to analyze the signals in a TwinCAT Measurement project.
Display signal curves in TwinCAT 3 Scope
If the drop is not made to the block diagram control but to an Axis Group in a TwinCAT Measurement project, the signal is added there.
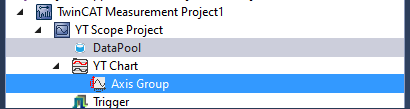
Add a signal in a TwinCAT 3 Scope