Debugging
In addition to debugging via the External Mode and via the Block Diagram in TwinCAT XAE, you can also use the C++ project created for debugging in the classic way.
Step-by-step procedure:
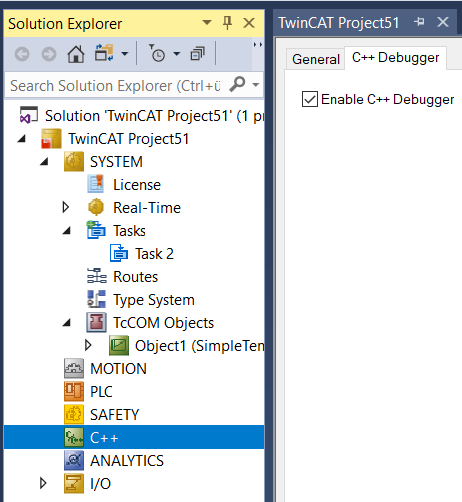
- 1. Make sure that your TwinCAT application has been activated with the C++ debugger enabled.
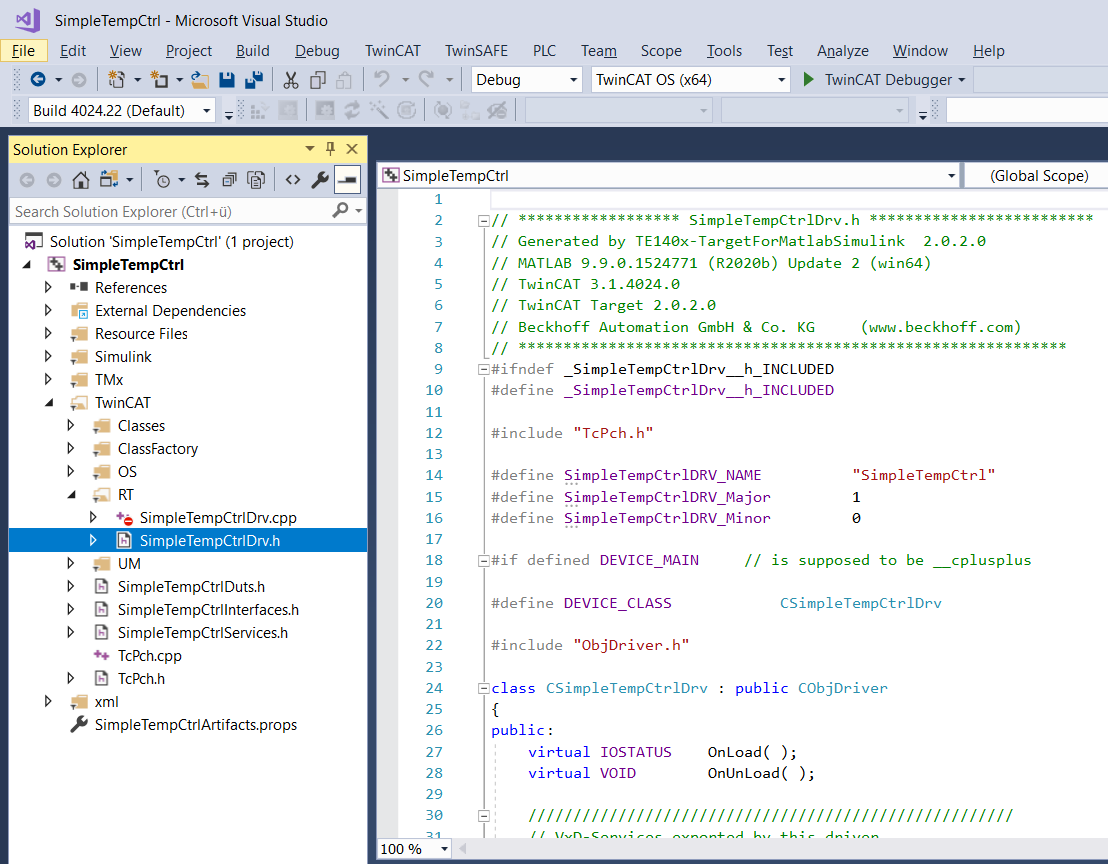
- 2. Open the C++ project created during code generation that belongs to the module you want to debug.
The project can be found in the folder <SimulinkModelName>_tcgrt, which is created in the current MATLAB® path when you start the code generation process. - 3. In this folder, search for the file <SimulinkModelName>.vcxproj.
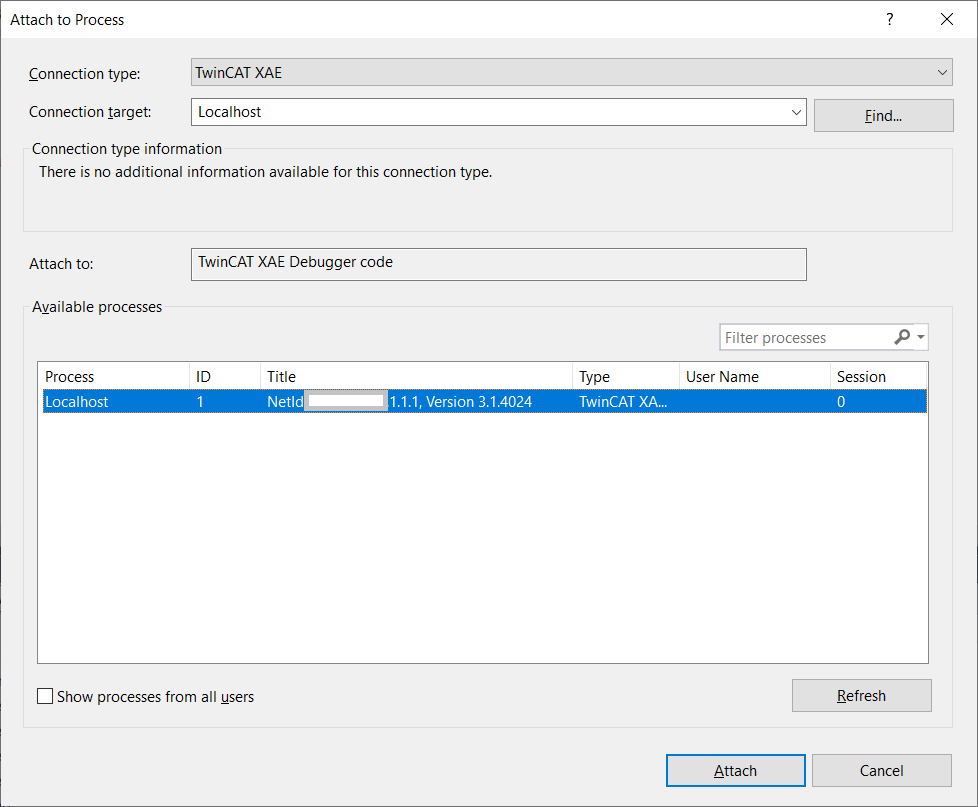
You can open the <SimulinkModelName>.vcxproj in Visual Studio alone or also add the vcxproj file in your TwinCAT Solution under C++ with "Add existing Item". - 4. Select Debug > Attach to Process in the menu bar and select "TwinCAT XAE" as Connection Type and your desired target system under Connection target. Then select Attach.
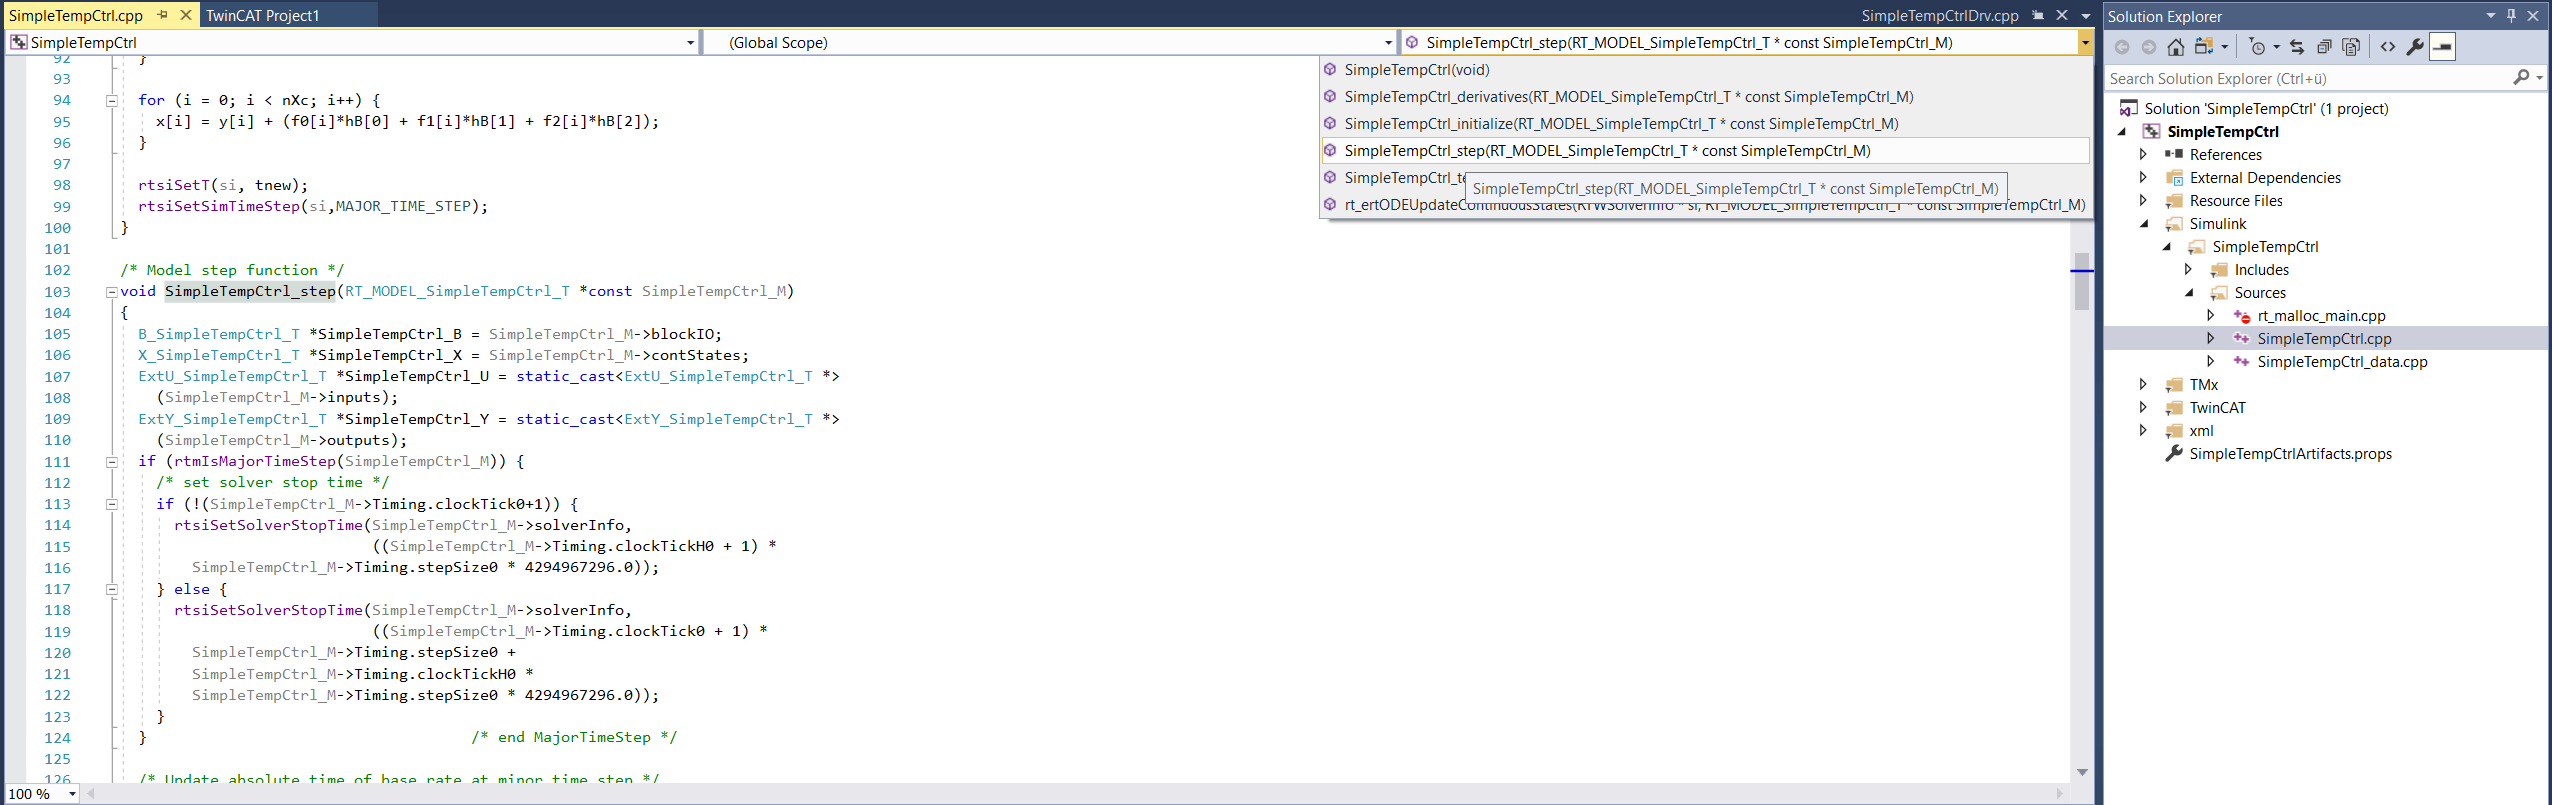
- 5. Set breakpoints in your C++ code and step through your code as usual. Tip: when executing the code, the step function is used, which you can find in the folder Simulink > Sources > <SimulinkModelName>.cpp.