Filter
The Table Chart provides a powerful and flexible filtering system that allows you to quickly locate specific channels, even in very large configurations. When working with snapshots (LINK TO SNAPSHOT DOCU), filtering can also be used to limit the saved data. Instead of saving the entire configuration, you can apply a filter and create a snapshot that includes only the currently visible (filtered) channels. This allows for smaller, more targeted snapshots tailored to specific use cases.
Syntax
The filtering syntax supports deeply nested logical expressions, including logical operators such as AND / && and OR / ||, comparison operators like >, <, =, and !=, as well as prioritization using brackets and string matching. All known binding rules apply, ensuring consistent and predictable behavior. For example, a valid filter expression could be:
Name = MySymbolName && (Value > 42 || Value < 23.2)Filters do not require a specific column to be specified. If you do not provide one, the filter engine evaluates all column values and matches the given expression across symbol names, namespaces, snapshot values, and other available columns. For instance, entering only
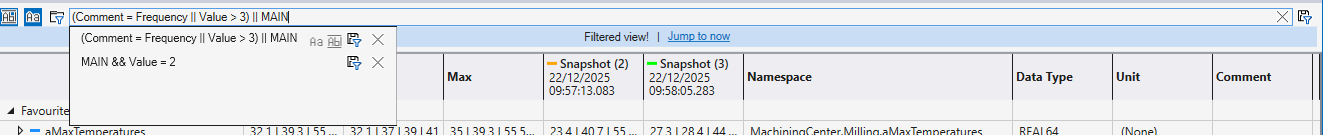
MAINis sufficient to match any row containing that value in any column. Expressions can combine both column-specific and non-specific conditions within a single filter. For example, the expression
MAIN && Value = 2 searches for rows that contain the term MAIN in any column while simultaneously requiring the Value column to be equal to 2. This allows you to mix broad, free-text matching with precise, column-based comparisons to create concise yet powerful filter expressions.
Additional match options are available to further refine results. You can enable Match Case to enforce case-sensitive matching or Match Whole Word to restrict matches to complete terms only.
Visuals
Whenever a filter is active, the Table Chart provides clear visual feedback to indicate that a filtered view is being displayed. Rows that do not match the filter criteria are automatically hidden. Applying a filter pauses the chart to avoid flickering of row visibilities. A button allows to jump the time position of the chart to the current timestamp. However, the chart can also be resumed to update live again, which will then trigger a reevaluation of the filter on changes of any values. This is optimized so that no unnecessary evaluations are made.

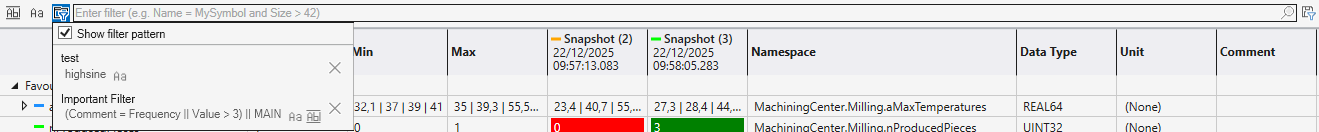
Recent Filters and Filter Library
To improve usability, the filter input keeps track of recently used filter expressions, allowing quick reuse of common search patterns.
In addition, complex filter expressions can be saved to a Filter Library, enabling efficient reuse across different sessions and configurations.