Creating and editing a Scope project
To enable fast familiarization and to simplify working with the TwinCAT 3 Scope software oscilloscope, important information is summarized and the first steps briefly described on the following pages.
1. Installation
A Scope Server is always installed with a Scope View, since otherwise no saved data can be displayed locally in the View. In contrast, the Scope component installation can install the Scope Server without Scope View on a target device.
2. Licensing
Regardless of whether you have installed the Scope View via its own setup or via the TwinCAT 3 XAE setup, the "base" licenses are initially activated for Scope View and Server. Please refer to the Overview to see which functions can be enabled with which license key.
3. Creating a new project
The Measurement Wizard supports you in the creation and configuration of a user-defined Measurement Scope project by guiding you automatically through the necessary steps on the basis of successive dialogs.
 | You can also create your Scope project in the conventional way without the Measurement Wizard, see TwinCAT Target Browser. |
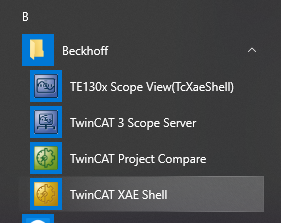
- 1. Open Beckhoff > TwinCAT XAE Shell in the Windows Start menu.
- Visual Studio opens in its shell or in a full version if installed.
Start the Measurement Wizard
- 1. On the start page, select a TwinCAT measurement project (for example YT Scope Project).
- 2. Select the Measurement Wizard in the following dialog box.
- 3. Enter the project name and storage location and confirm your entries with OK.
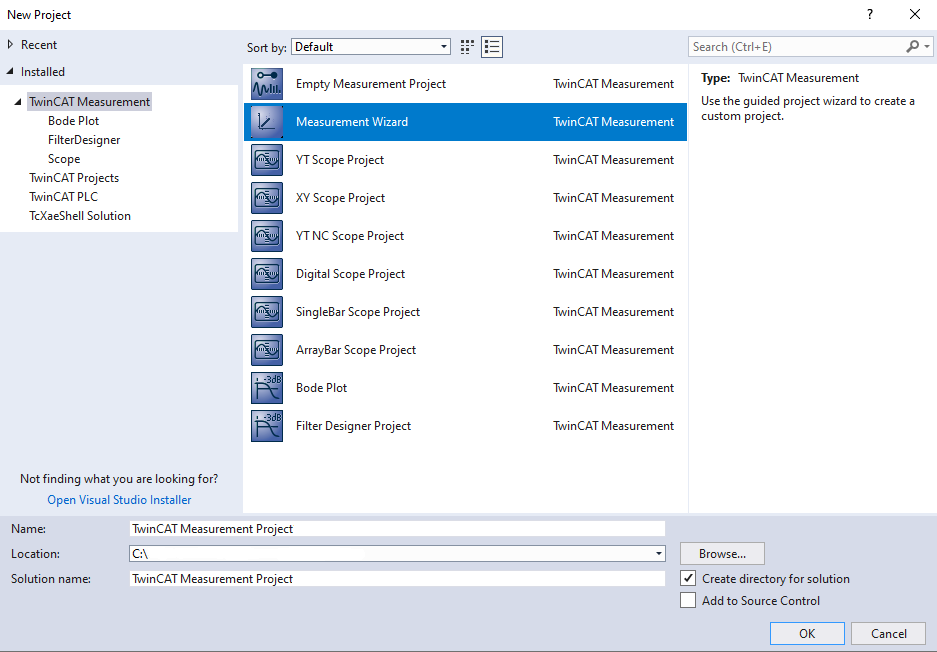
- The Measurement Wizard for TwinCAT 3 Scope View, Filter Designer and TwinCAT 3 Bode Plot opens.
Select program variant
- 1. Select a TC3 Scope View.
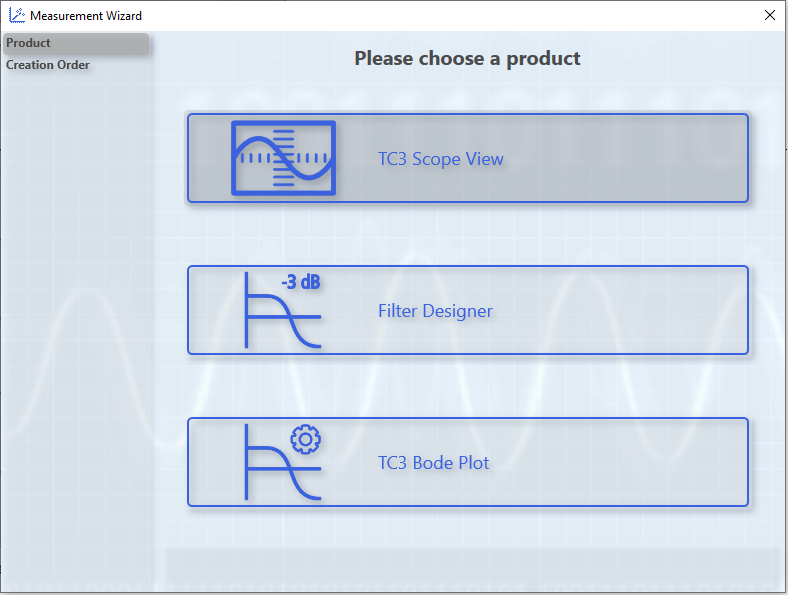
- You can make coordinated settings in the following dialog box.
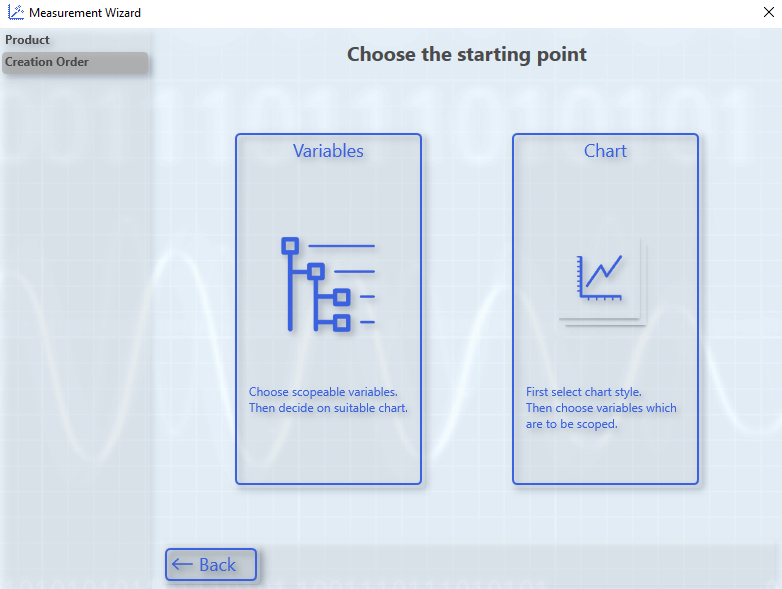
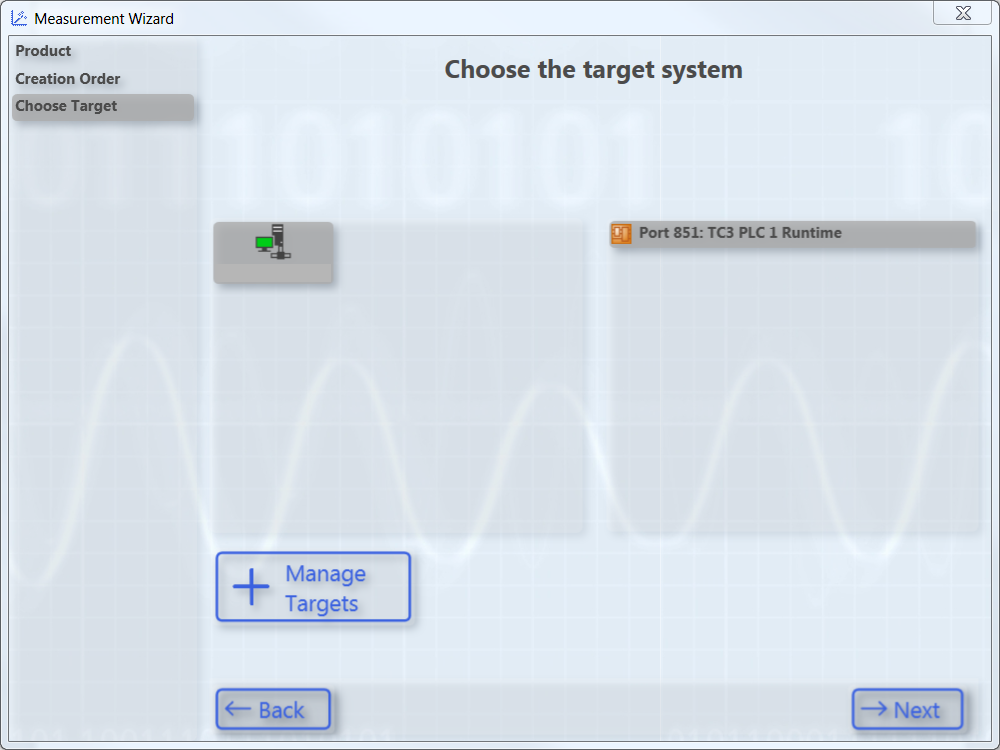
Define the starting point and select the target system
- 1. Click the Variables button.
- With this option you initially select the variables that are to be recorded and graphically displayed.
- 2. Select the target system and the corresponding ADS port.
- 3. Click the Next button.
- 4. In the following dialog box, select the variables that are to be recorded and graphically displayed.
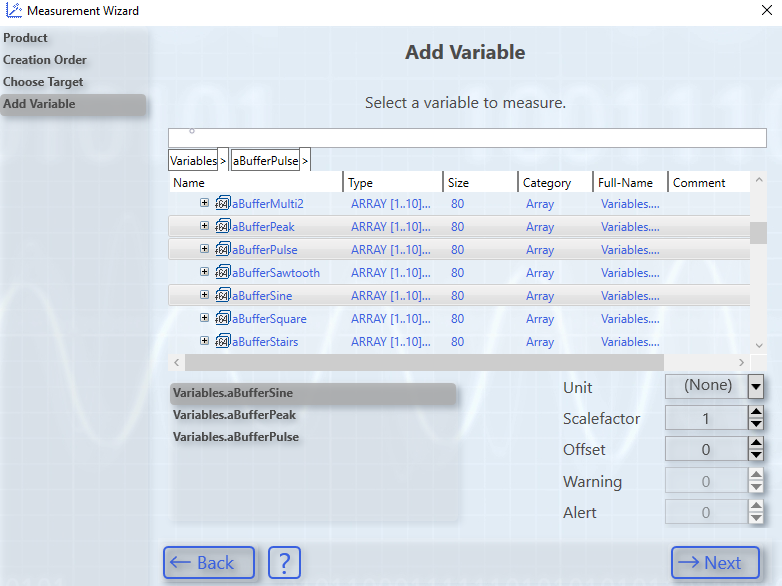
- You have various options in this area:
- Navigate through the menu.
- Enter a variable name in the text box for filtering.
- Enter a different scaling factor and an offset.
- Enter a warning level and an alert level.
- With these values you configure the dynamic style function for these variables. From the warning threshold, the graph is displayed in yellow and from the alert in red.
- 5. Click Next.
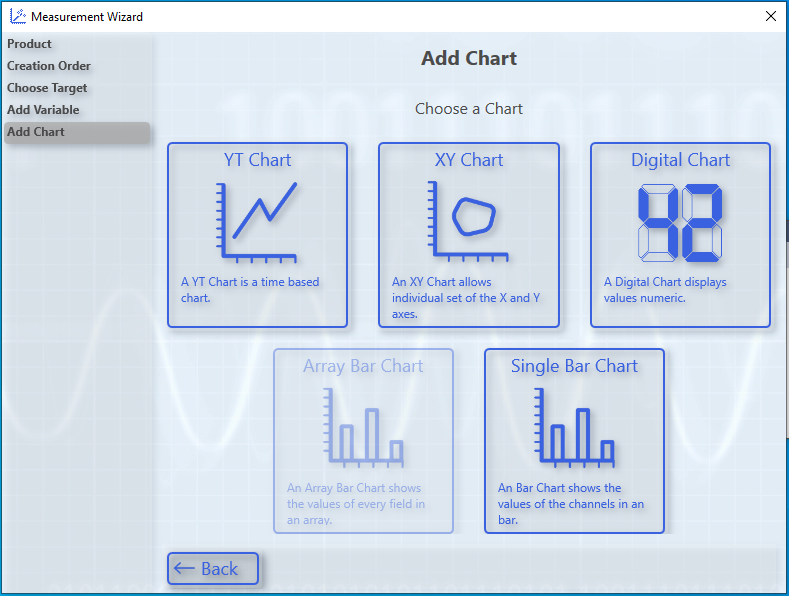
Adding a chart and configuring axes
- 6. Select the chart type.
- You can only select chart types that match your variable selection. By way of example, here is a YT chart.
- 7. Add further axes if necessary.
- Configure further axes in accordance with the menu navigation and assign variables to them.
- 8. You can go back and undo/change the selection via Back.
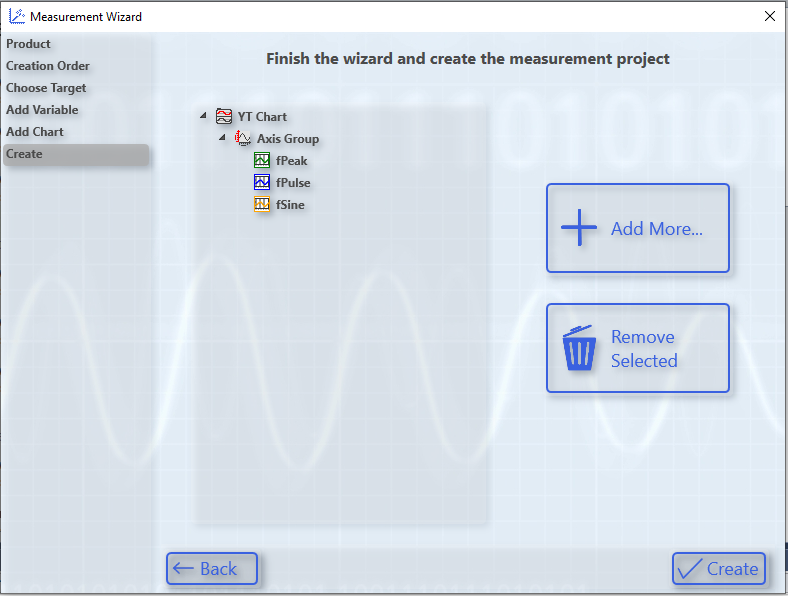
- 9. Finally, click the Create button.
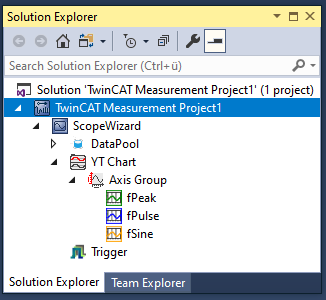
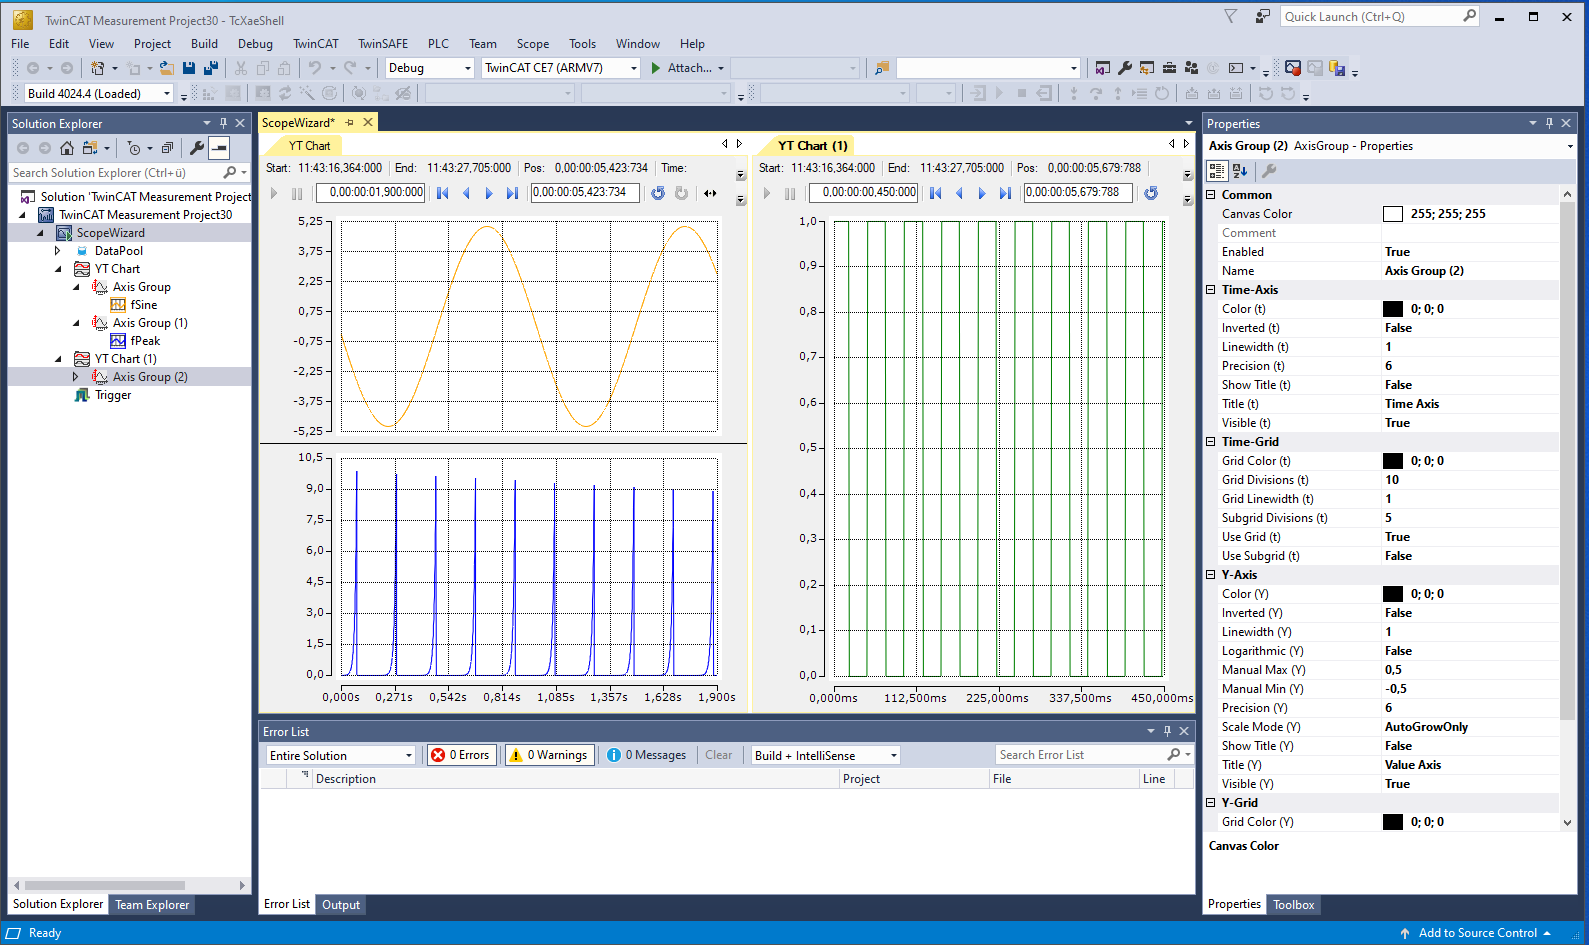
- In the Solution Explorer the starting point for the new Scope configuration assembles itself automatically.
Defining the settings
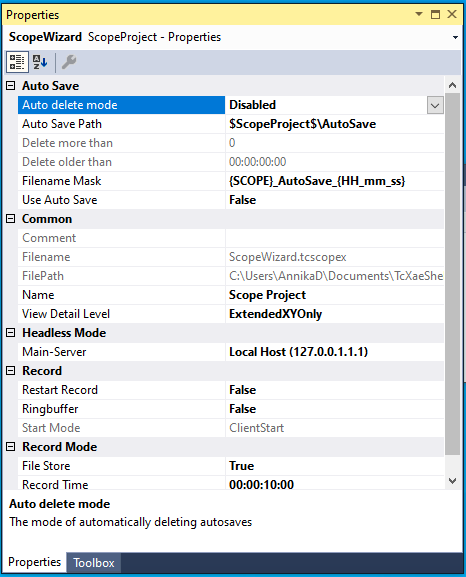
Prior to a recording, the basic settings for the recording must be defined in the scope properties.
- 1. Select the respective element in the Solution Explorer.
- If the Properties window is not yet open, you can
open it via the Properties command in the View menu.
The default setting is a ten-minute recording that starts manually and stops automatically after the specified time.
In the standard Properties window you can make settings for:
- all hierarchical levels of the scope,
- chart,
- axis,
- channel,
- trigger and
- marker.
Starting and ending the recording
- When using for the first time, the TwinCAT Measurement toolbar must be activated in the menu View > Toolbars.
- 1. Click the icon with the red record symbol to start the recording.
- 2. Click the icon with the blue symbol to end the recording.

- The standard recording time is 10 minutes.
Pausing the recording in the view
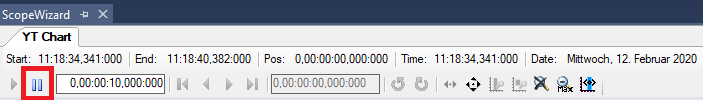
- 1. Click the pause icon in the chart.
- The graph is paused for viewing only.
| While you pause the view in the chart using the pause icon, the recording continues to run in the background. You can pause the display in this way in order to zoom into the data or to analyze the signal curve. |
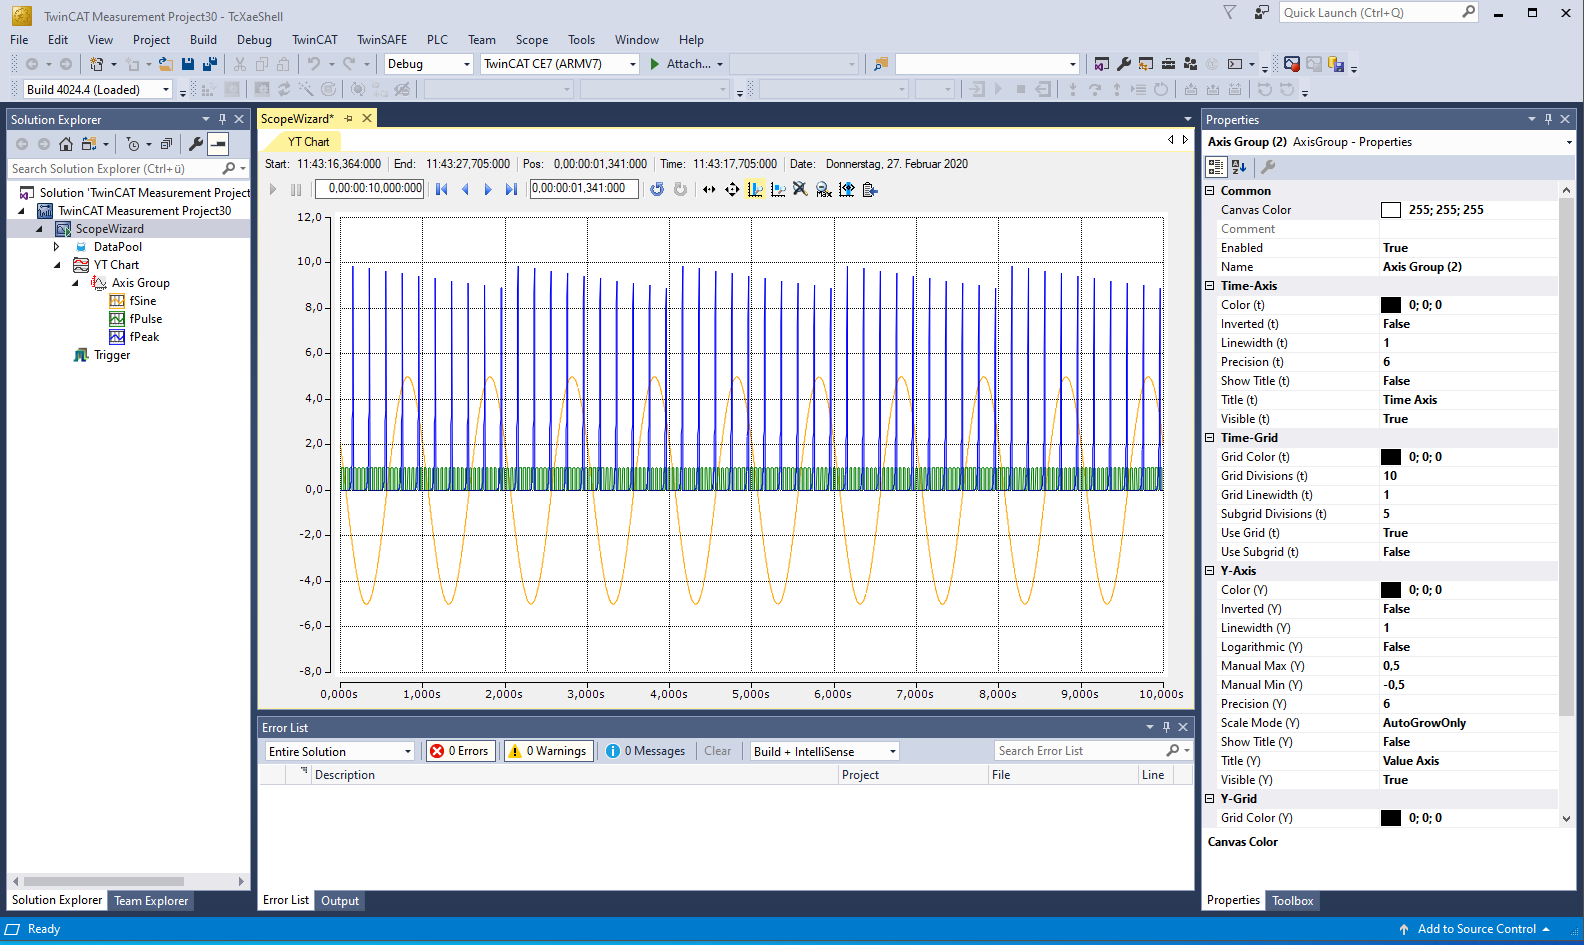
Changing the display
In order to improve the display of the channels in the View, charts and axes can be added even during the recording in TwinCAT 3 Scope View and channels can be shifted within the scope.
Adding charts or axes and shifting channels
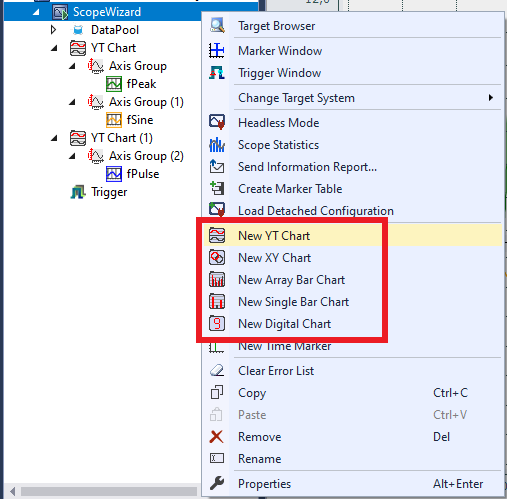
- 1. In order to generate a new chart, right-click ScopeWizard and select the desired chart.
- 2. In the tree structure of the Solution Explorer, drag and drop the desired channel to the newly created chart.
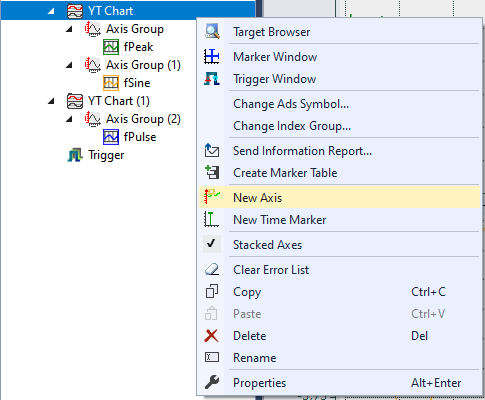
- 3. To create a new axis, right-click the respective chart and select New Axis.
- 4. In the tree structure of the Solution Explorer, drag and drop the desired channel to the newly created axis.
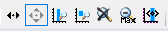
- If necessary, use the icons in the respective chart for zooming and shifting in order to observe the signal curve more precisely.
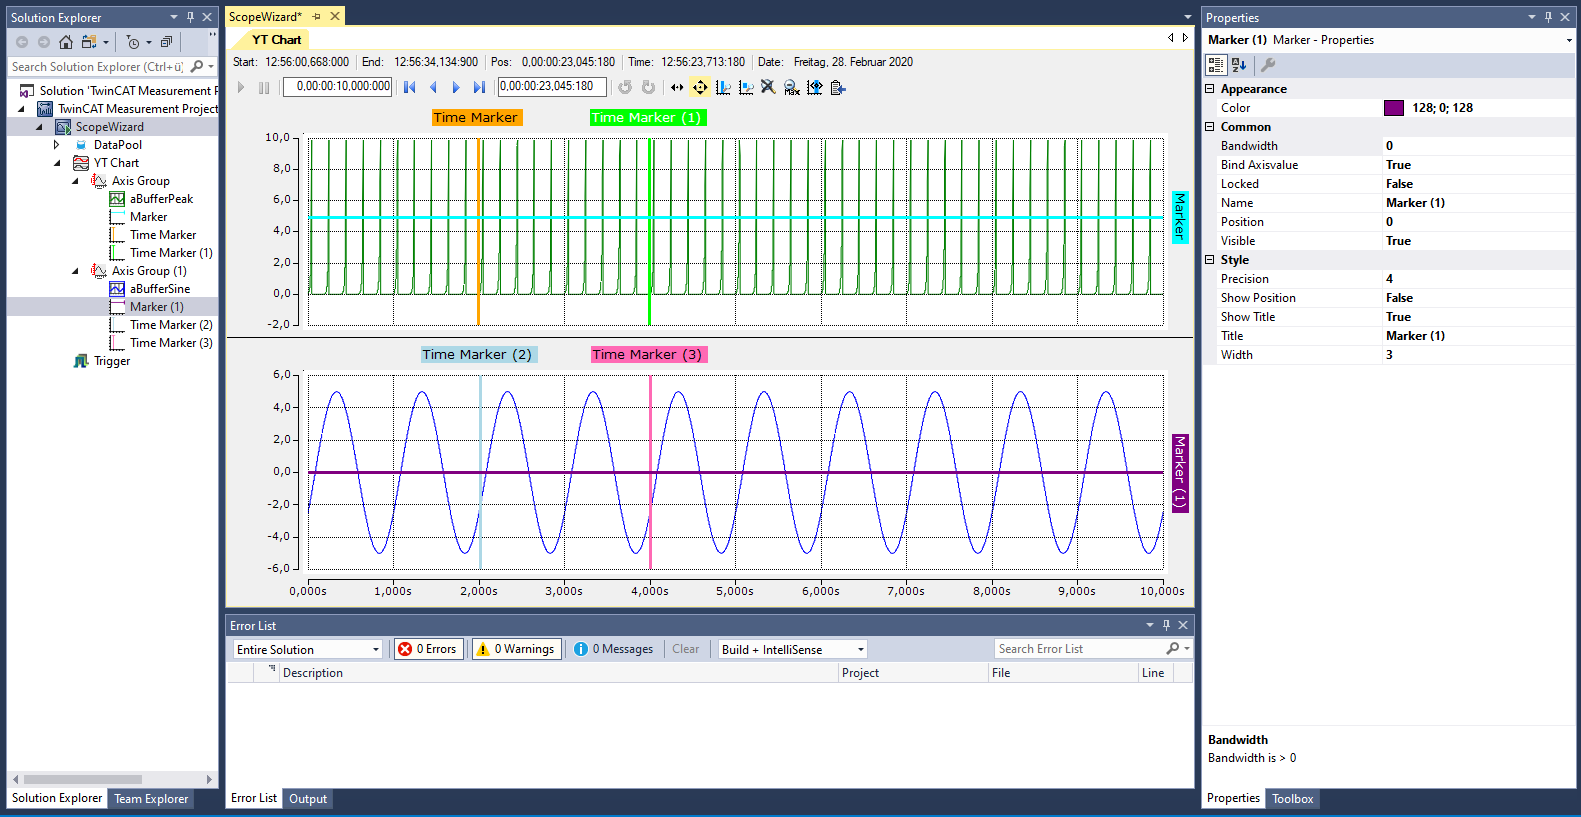
Adding markers to the axes
| A marker is a chart element that can be docked to an axis. It is displayed as a line in the View and can be evaluated and compared with other markers in the Marker window. |
- 1. Right-click the respective chart and select the desired markers for the X- and Y-axes.
- 2. If you wish to analyze the signal curve more precisely, click the pause icon in the respective chart and zoom into the data.
- You can edit the markers in the properties window in the display and evaluate them in the Marker window.
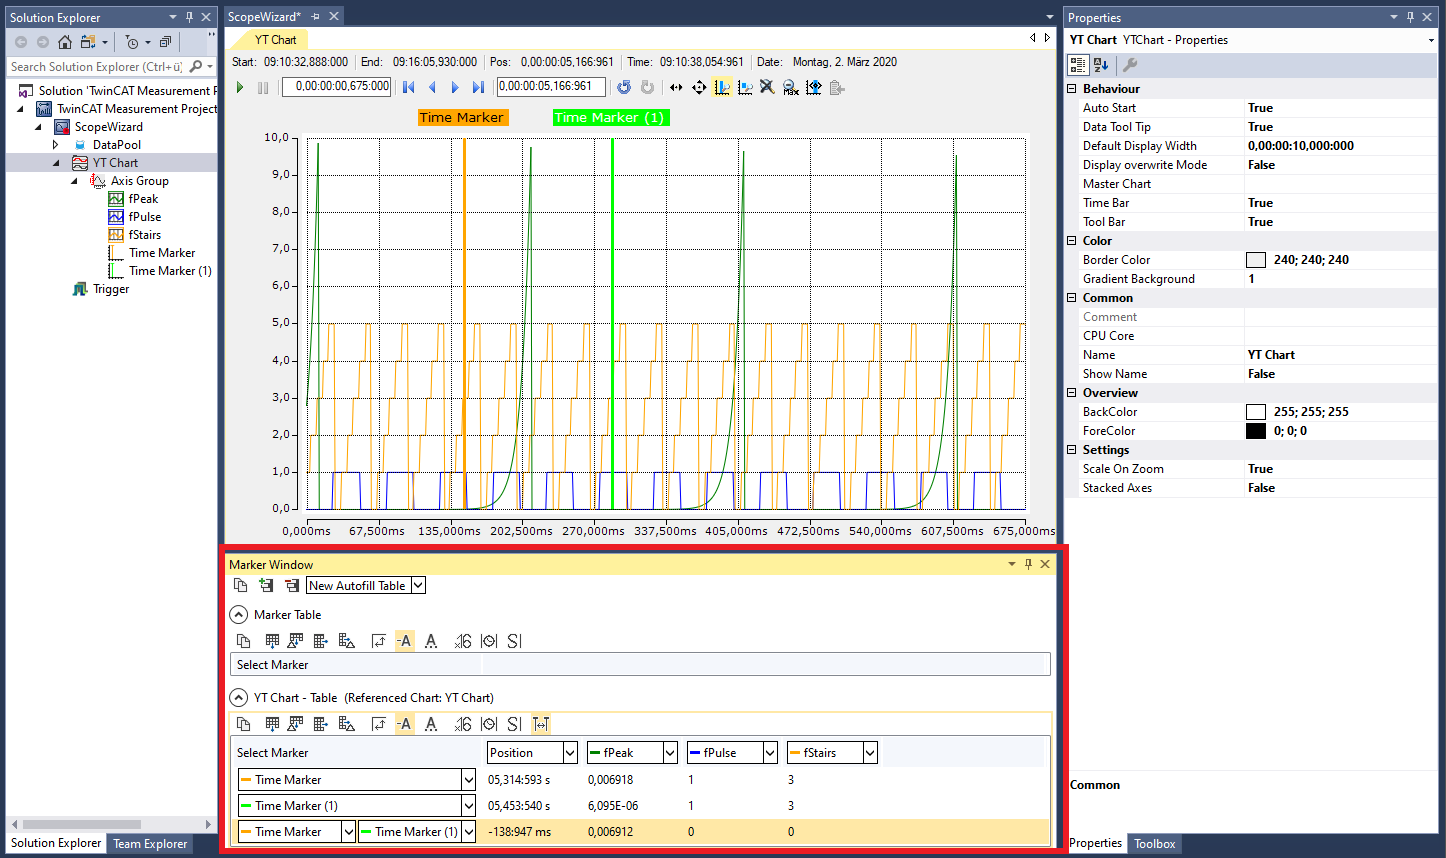
Marker Window
Showing and hiding
- 1. Right-click the respective chart and select Marker Window.
- The Marker window is displayed and can be shown clearly under the view for the analysis of the set markers.
- 2. In the drop-down menu at the top in the Marker window, select the option New Autofill Table and the corresponding chart.
- Important parameters will be displayed automatically.
- 3. As an alternative to the auto-fill option, you can combine everything individually using the Add… command in the toolbar.
- 4. Click the comparison tool in the toolbar of the Marker window to display the differences between the set markers and the corresponding signal curves.
- The position is constantly displayed. It mirrors the X-axis.
Save data
The data can be exported in various data formats for further processing.
- The recording must be ended via the TwinCAT Measurement toolbar, or must have been ended automatically after the pre-set expiry time.
- 1. In the program, go to Scope > Export….
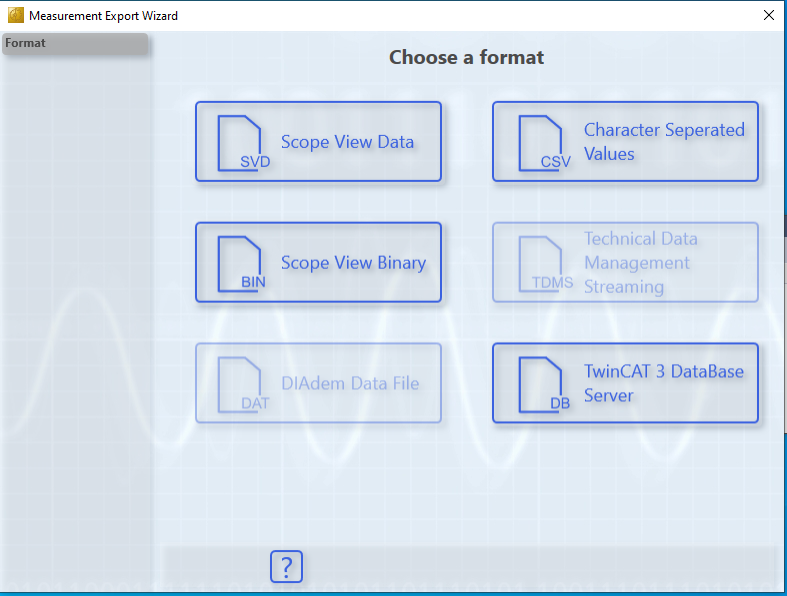
- 2. For this sample, select the file type Scope View Data (SVD).
- 3. Select the time period to be saved and click Next.
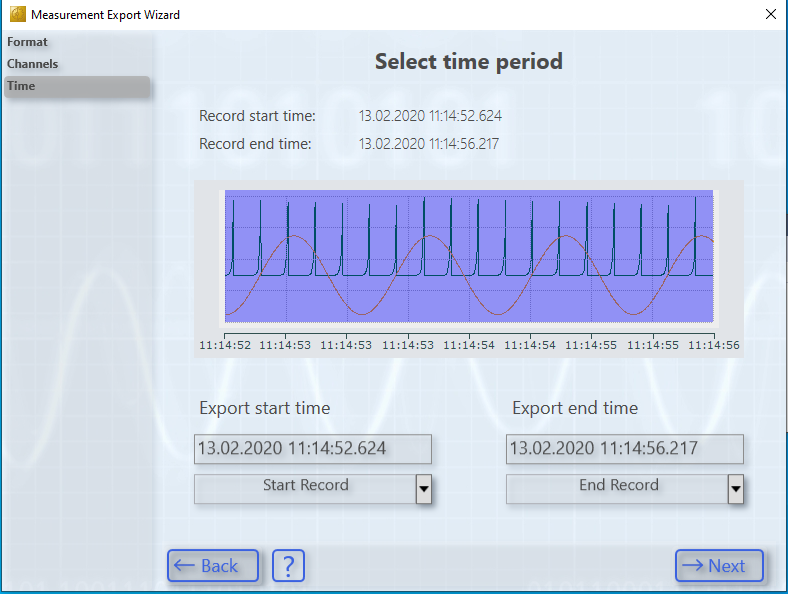
- 4. Select the storage location and click Create.
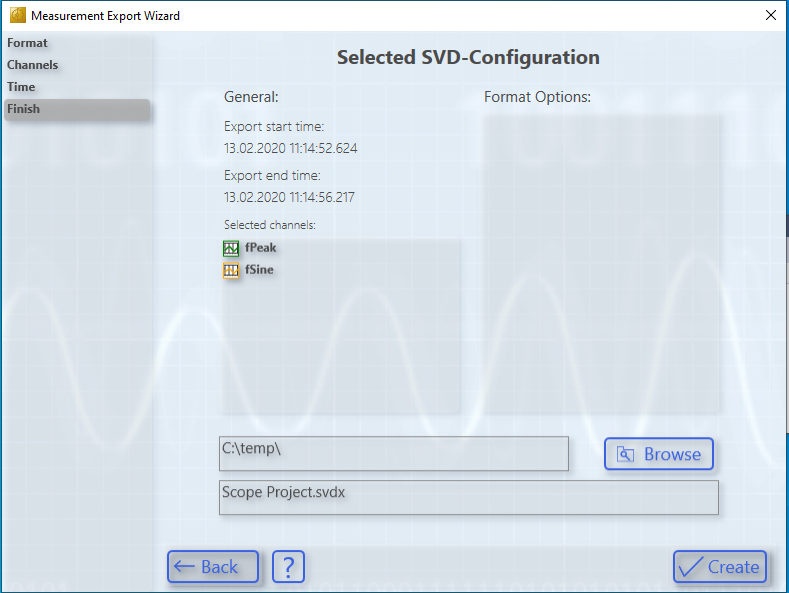
- You have now created an SVD file.