Filter
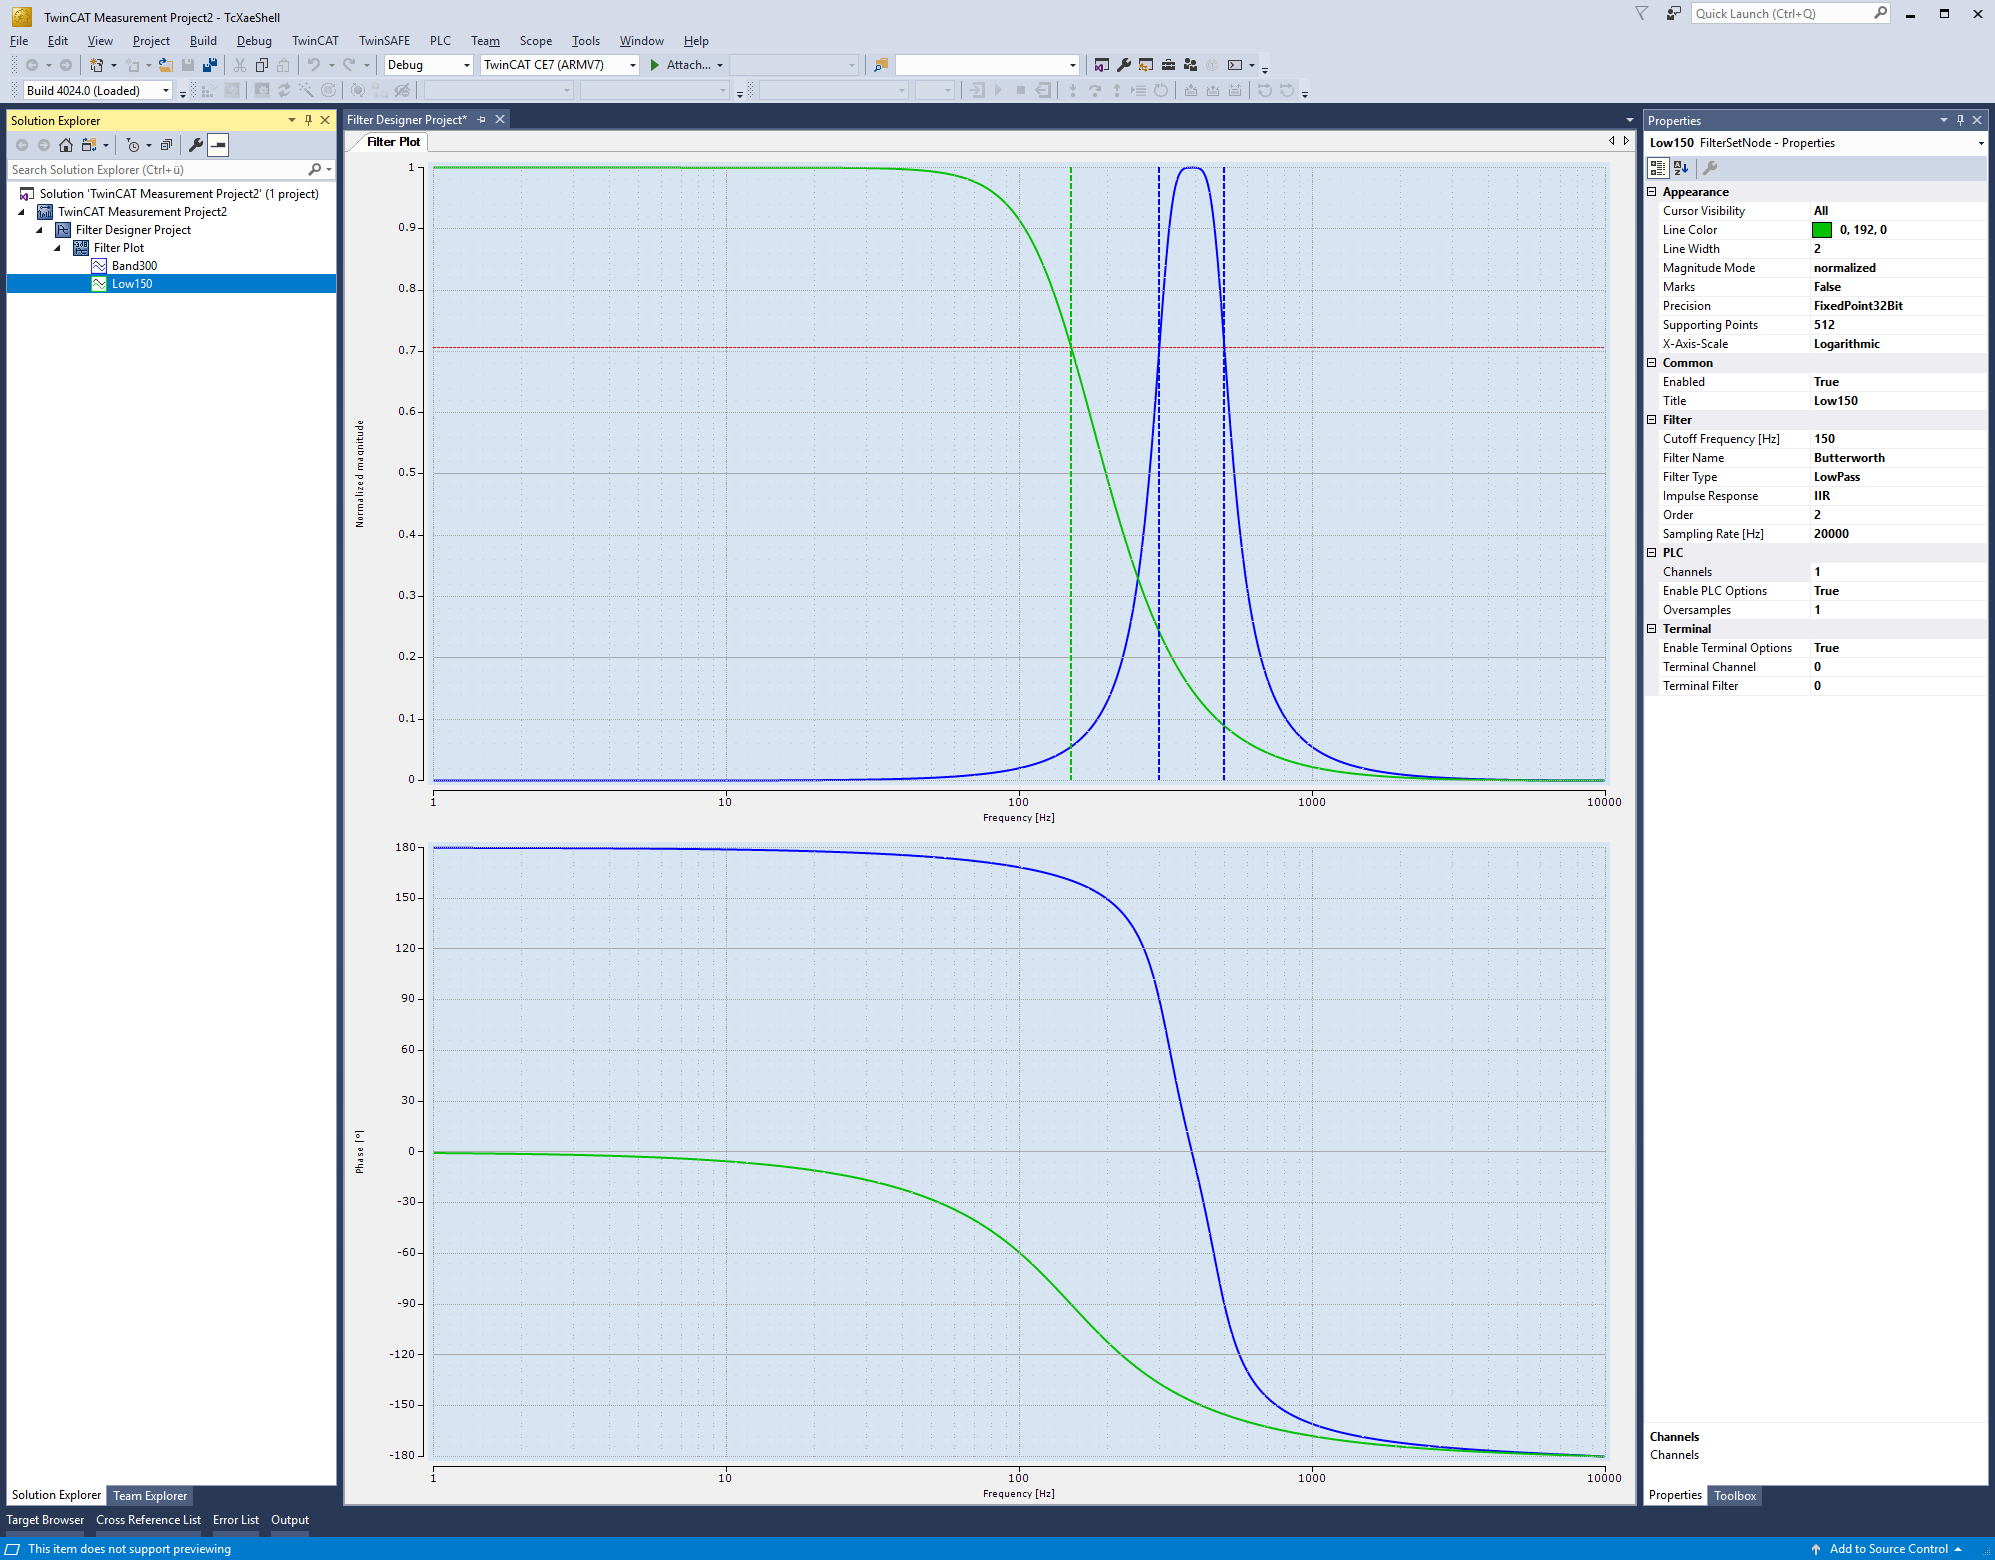
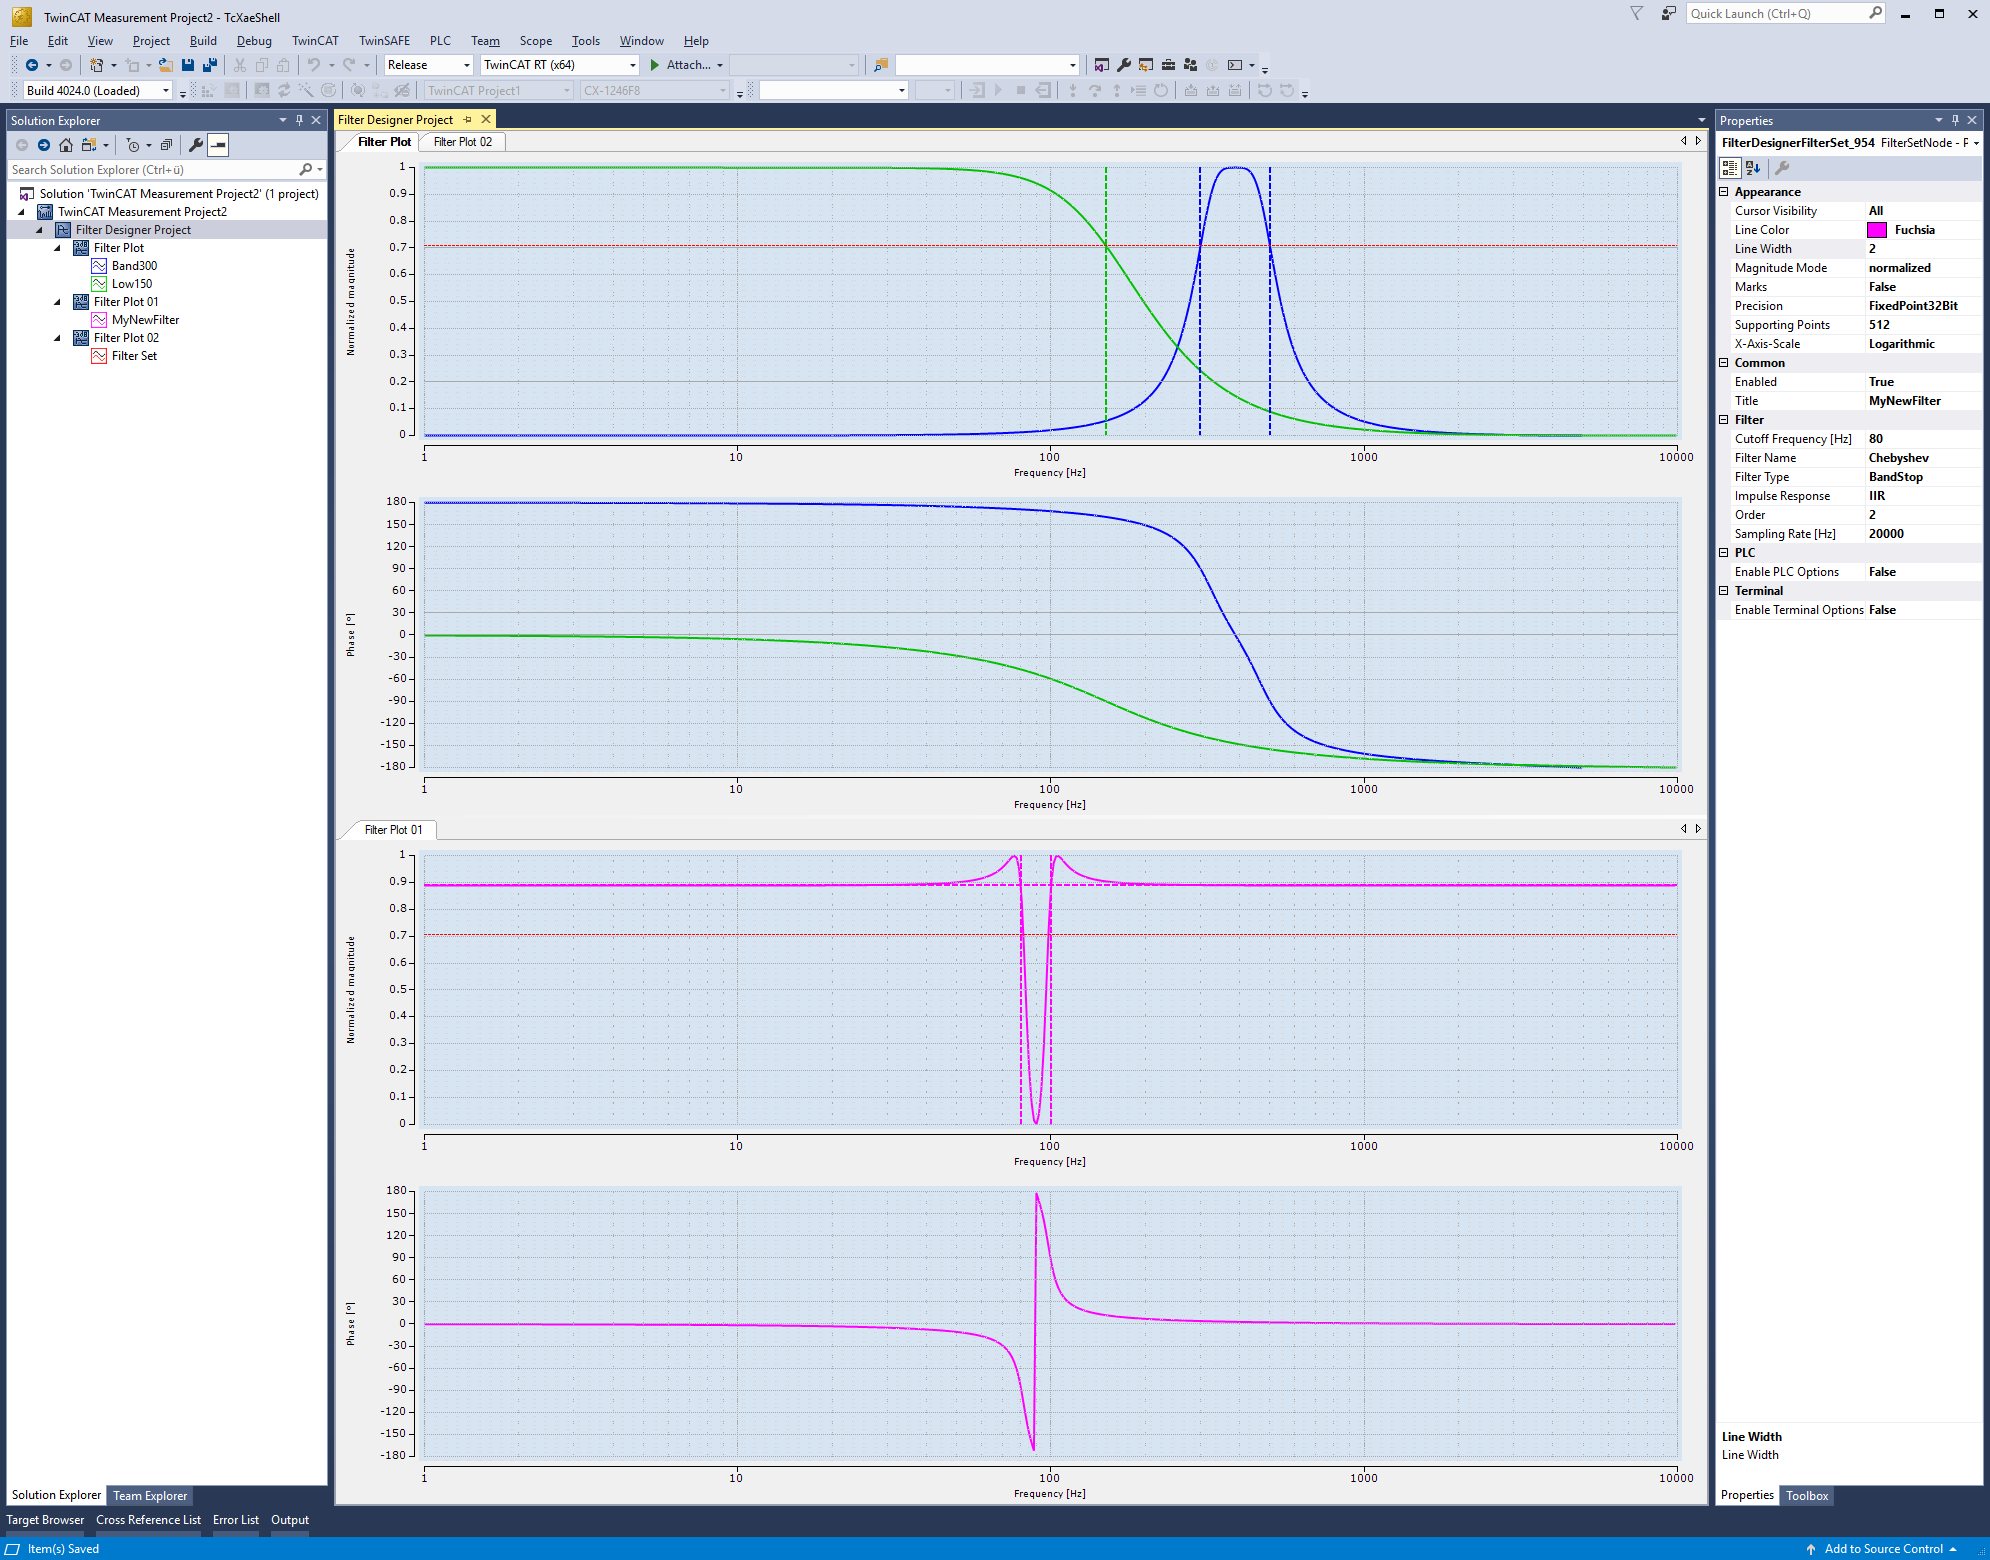
Depending on how you have created the filter project, at least one or more filter sets are visible in the Solution Explorer tree. A filter set maps a filter curve in the plot. You can add further filter sets to the plot at any time using the context menu.
Of course, it is also possible to maintain several plots in parallel in a project.
The corresponding properties are described in the following sub-chapters, starting with the filter and the filter type.
Further Information