Window Records
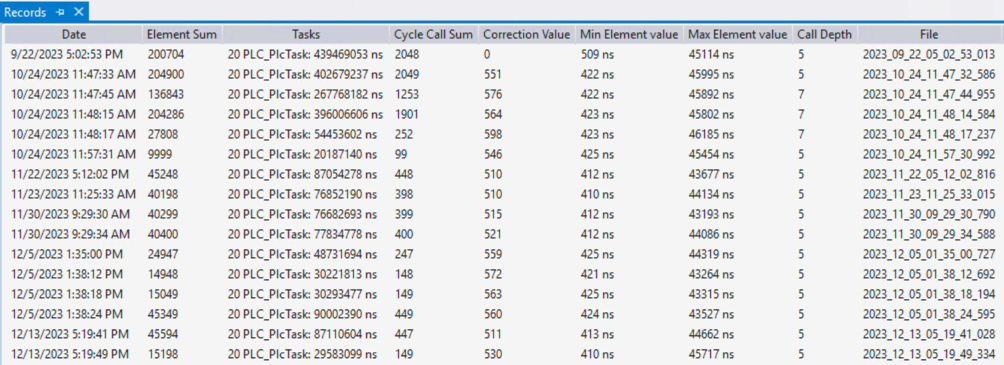
All previous Profiler recordings are listed in a table in the window Records.

The following information is listed in detail:
Column | Property |
|---|---|
Date | Timestamp of the recording |
Element Sum | Number of measured program calls over the entire measurement |
Tasks | All tasks that were measured in the recording. |
Cycle Call Sum | Number of measured program calls per cycle |
Correction Value | Runtime determined for the Profiler measurement mark. |
Min Element Value | Minimum call-up time of an element in the recording |
Max Element Value | Maximum call-up time of an element in the recording |
Call Depth | Maximum call depth during recording |
File | Name of the file |
Context menu
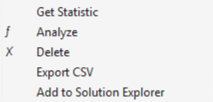
The following actions can be carried out in the context menu of the window Records.

Action | Property |
|---|---|
Get Statistic |
|
Analyze | Starts the analysis and opens the report. |
Delete | Delete recording. |
Export CSV | Export recording as CSV. |
Add to Solution Explorer | Add recording to the Solution. The recording is added to the Solution as a separate file and is therefore included in Source Control and the archive. |