Window Records
All previous Profiler recordings are listed in a table in the Records window.
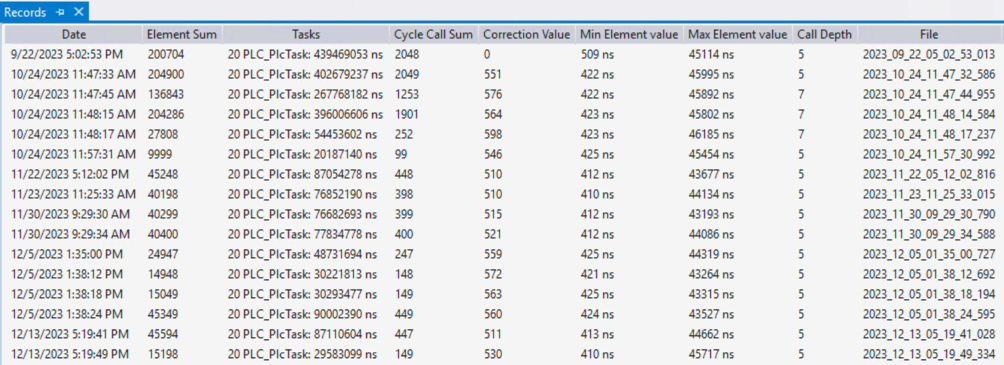
The following information is listed in detail:
Column | Property |
|---|---|
Date | Timestamp of the recording |
Element Sum | Number of measured program calls over the entire measurement |
Tasks | All tasks that were measured in the recording. |
Cycle Call Sum | Number of measured program calls per cycle |
Correction Value | Runtime determined for the Profiler measurement mark. |
Min Element Value | Minimum call-up time of an element in the recording |
Max Element Value | Maximum call-up time of an element in the recording |
Call Depth | Maximum call depth during recording |
File | Name of the file |
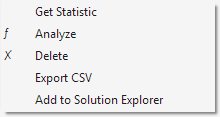
Context menu
The following actions can be carried out in the Records window context menu.
Action | Property |
|---|---|
Get Statistic | Calculates the min. and max. element values of the recording if these are missing. In the regular process, these statistics are already calculated automatically when the recording is added to the overview list. In this case, executing the command again has no effect. |
Analyze | Starts the analysis and opens the report. |
Delete | Delete recording. |
Export CSV | Export recording as CSV. |
Add to Solution Explorer | Add recording to the Solution. The recording is added to the Solution as a separate file and is therefore included in Source Control and the archive. |
Storage location of the files
The profiler files are saved within the PLC project directory.
File type | Location |
|---|---|
Configuration files | <Projektverzeichnis>\<SPS-Projektname>\<Konfigurationsname>\config.xml |
Recording files | <Projektverzeichnis>\<SPS-Projektname>\<Konfigurationsname>\ with the timestamp as the file name (format: yyyy_MM_dd_hh_mm_ss_fff.csv) |
Description file | <Projektverzeichnis>\<SPS-Projektname>\<Konfigurationsname>\description.xml |
The recording files contain the raw data of the measurement in CSV format.