Statistics
In order to be able to make statements about the configuration of the real-time system, it is possible to generate statistics with the help of the TwinCAT 3 Realtime Monitor (see chapter Reference > User Interface > Statistics).
Creating and displaying statistics
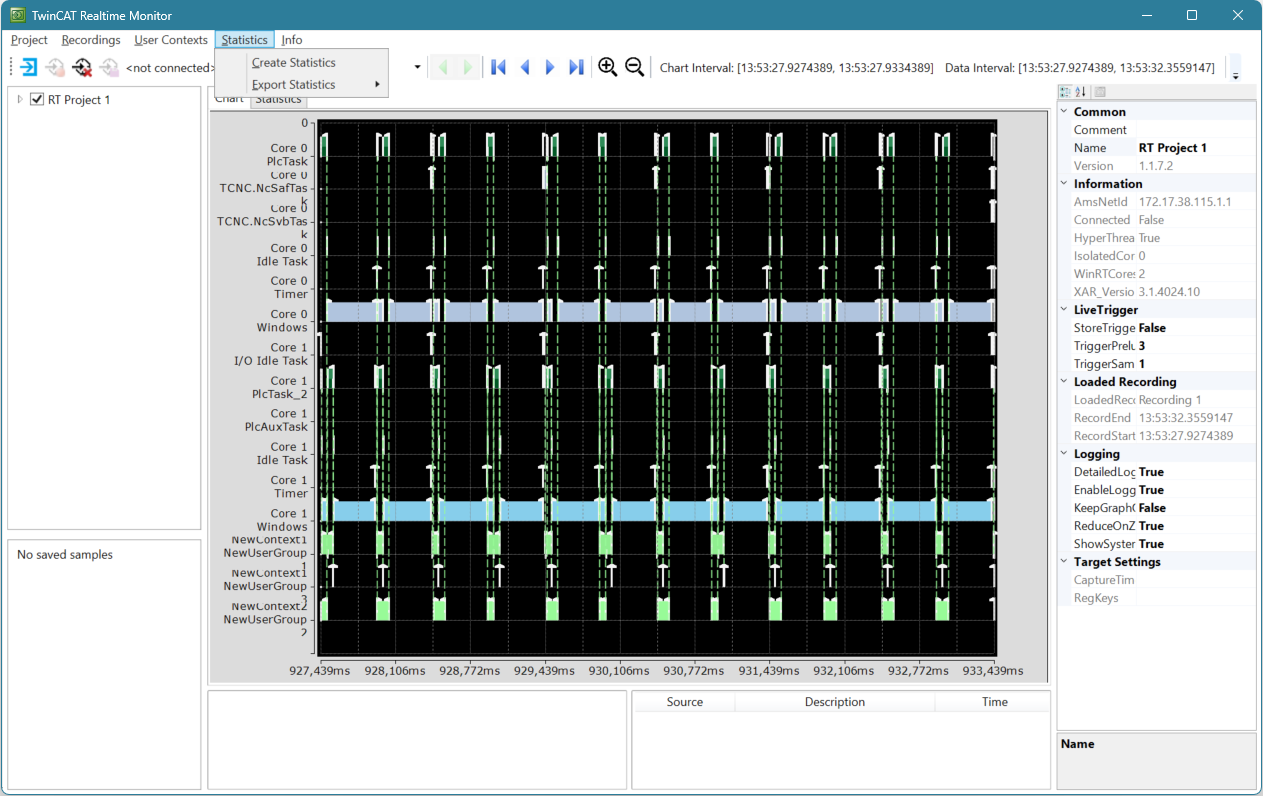
- 1. To create statistics for the loaded project, select Create Statistics in the Statistics menu.
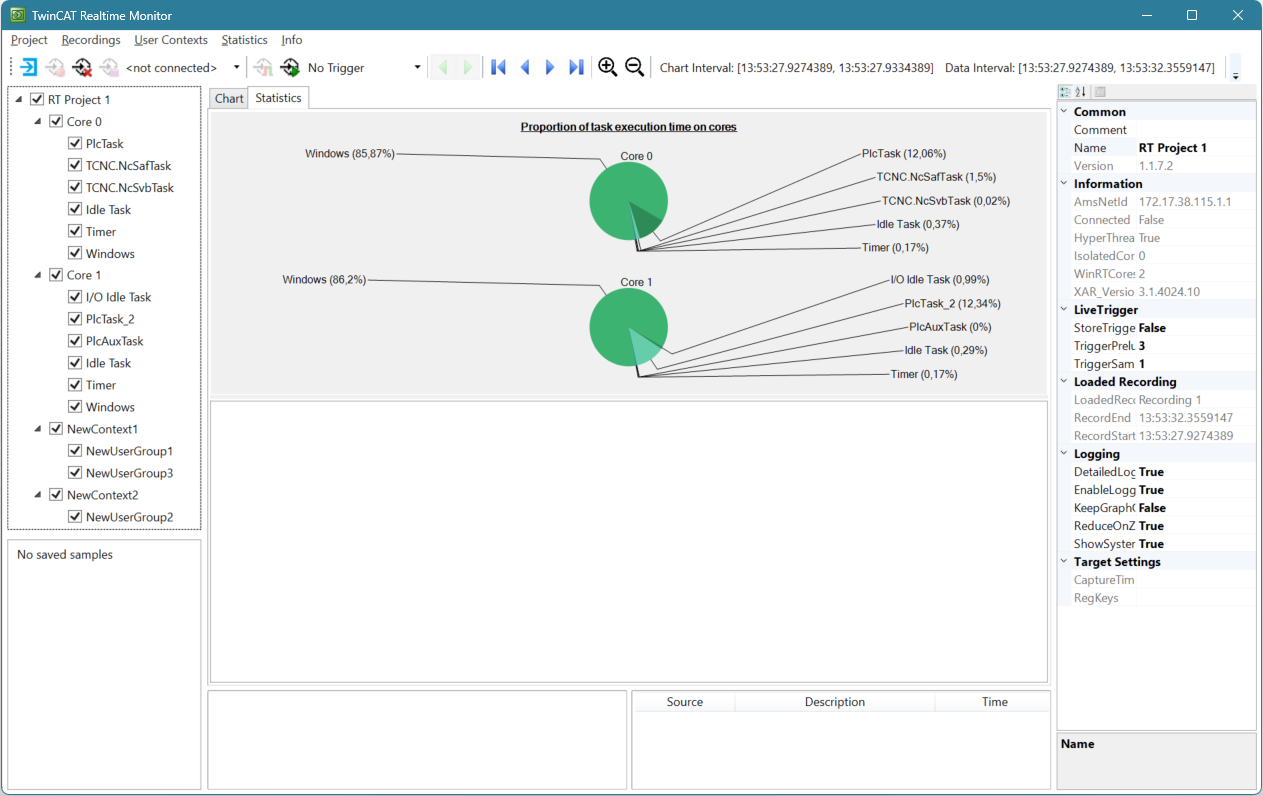
- The statistics are created and the following view opens:


The distribution of execution times per real-time kernel is displayed as a pie chart. The sum of all tasks executed on a real-time kernel, including the idle task and possibly the operating system context (except on isolated cores), is always 100%.
You will see a similar display for a single real-time kernel if you select one of the real-time kernels used in the project tree.
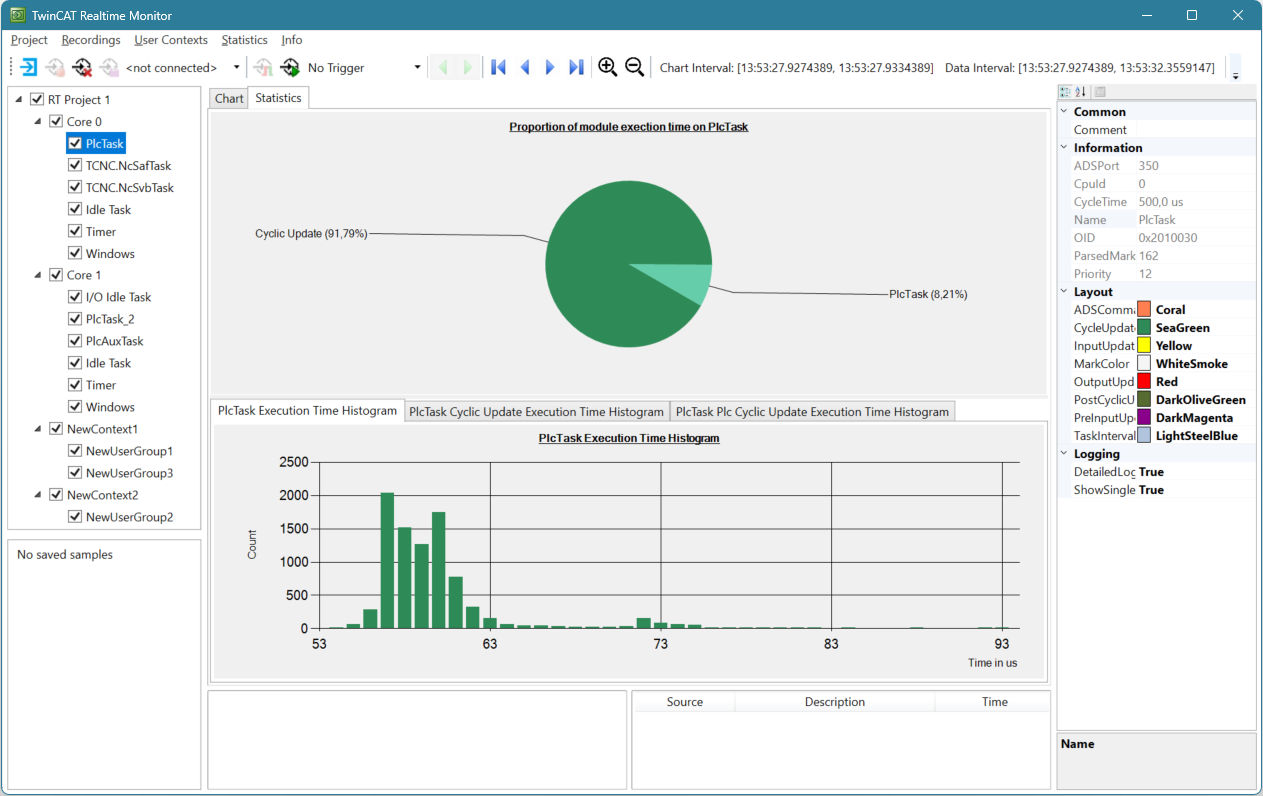
In the area below the pie chart, you can see the changes in execution times over time as a histogram distributed over several tabs (one per TwinCAT task).
A more accurate analysis of the time behavior is possible if you select a real-time task directly in the project tree. For a PLC task, you get the view in which the cycle update, i.e. the area in which the application code is executed, is displayed in a separate tab.
The bar chart shows the distribution of execution times over the recorded period. To see all execution times, scroll with the mouse wheel on the bar chart. This allows you to zoom in and out of the display.

If you want to see in which context a corresponding cycle time occurred for the first time, proceed as follows:
- 1. Double-click with the left mouse button on the corresponding bar in the distribution.
- The timestamp is entered after the Jump to field and highlighted in yellow.
- 2. Click on the Jump to button to switch to the chart view.
- The corresponding timestamp is displayed in the center of the chart.
- 3. To undo the selection in the Jump to window, click on any area in the chart view.

Export statistics:
If further analyses are to be carried out in your own tools, the individual timestamps of the tasks can be exported. The export is done in *.csv file format.
- 4. In the Statistics -> Export Statistics menu, select the time context you wish to export.
- You will receive a *.csv file with the corresponding timestamps.

It is also possible to export the statistics completely.
- 1. In the Statistics menu, select the Export all Statistic option.
- You will receive a ZIP archive containing a separate *.csv file for each time context in the project.