Positioning of Visualization Elements
Selecting Visualization Elements
The selection mode is activated by default. In order to select an element, click with the mouse on the element. You can also select the first element of the elements list by pressing the <Tab> key and jump to the next by each further keystroke. If you press the <Tab> key while pressing the <Shift> key, you jump backwards in the order of the elements list.
In order to select elements, which are placed one upon the other, first select the top level element by a mouse-click. Then do further mouse-clicks while the <Ctrl> button is pressed, to reach the elements in the underlying levels .
In order to mark multiple elements, press and hold the <Shift> key and click the corresponding elements, one after another; or, while holding down the left mouse button, pull a window over the elements to be selected.
In order to select all the elements, use the 'Extras' 'Select All' command.
If you are in the element list (called by 'Extras' 'Element list'), you can select the concerned element in the visualization by selecting a line.
Changing the Selection and Insert Mode
Changing the Selection and Insert Mode
After the insertion of a visualization element, there is an automatic change back into the selection mode. If you want to insert an additional element the same way, you can once again select the corresponding command in the menu or the symbol  in the tool bar.
You can also quickly change between the selection mode and the insert mode by pressing the <Ctrl>-key and the right mouse button simultaneously.
In the insert mode, the corresponding symbol will also appear at the mouse pointer, and the name will also be indicated in black in the status bar.
'Extras' 'Select'
This command is used to switch the selection mode on or off. This can also be achieved using the symbol or by pressing the right mouse-key while holding down the key at the same time.
Copying Visual Elements
One or more selected elements can be inserted with the 'Edit' 'Copy' command, the <Ctrl>+<C> key combination, or the corresponding copy symbol, and with 'Edit' 'Paste'.
A further possibility is to select the elements and to again click in one of these elements with the <Ctrl> key held down. If you now hold the left mouse button down, you can separate the elements thus copied from the original.
Modifying Visualization Elements
You can select an element which has already been inserted by a mouse click on the element or by pressing the <tab> key. A small black square will appear at each corner of each of the elements, (with ellipses at the corners of the surrounding rectangle). Except in the case of polygons, lines or curves further squares appear in the middle of the element edges between the corner points.

With a selected element, the turning point (balance point) is also displayed at the same time. You can then rotate the element around this point with a set motion/angle. The turning point is displayed as a small black circle with a white cross (  ). You can drag the turning point with a pressed left mouse button.
You can change the size of the element by clicking on one of the black squares and, while keeping the left mouse button pressed, controlling the new outline.
With the selection of a polygon, you can drag each individual corner using the same technique. While doing this, if you press the <Ctrl>-key then an additional corner point will be inserted at the corner point, an additional corner point will be inserted, which can be dragged by moving the mouse. By pressing the <Shift>+<Ctrl>-key, you can remove a corner point.
Dragging Visualization Elements
One or more selected elements can be dragged by pressing the left mouse button or the arrow key.
Grouping Elements
Elements can be grouped by selecting all desired elements and performing the command 'Extras' 'Group'. The group will behave like a single element:
- the grouped elements get a collective frame; when dragging the frame all elements will be stretched or compressed; only the group can be moved to another position.
- the grouped elements get collective properties: inputs only can effect the group and not a single element. Thus the elements also get one collective configuration dialog (category 'group'). The property 'Change color' can not be configured for a group !
To redefine a single element of a group, the grouping must be redone by the command 'Extras' 'Break up group'. The configuration of the group will be lost in this case.
.
'Extras' 'Send to Front'
Use this command to bring selected visualization elements to the front.
'Extras' 'Send to Back'
Use this command to send selected visualization elements to the back.
'Extras' 'Align'
Use this command to align selected visualization elements.
The following alignment options are available:
- Left: the left edge of each of the elements will be aligned to the element that is furthest to the left
- the same is true for Right / Top / Bottom
- Horizontal Center: each of the elements will be aligned to the average horizontal center of all elements
- Vertical Center: each of the elements will be aligned to the average vertical center of all elements
'Extras' 'Elementlist'
This command opens a dialog box containing a list of all visualization elements including their number, type, and position. The position is given according to the x and y position of the upper left (x1, y1) and the lower right (x2, y2) corner of the element.
When one or more items have been selected, the corresponding elements in the visualization are marked for visual control and if necessary, the display will scroll to that section of the visualization that contains the elements.
Use the To front button to bring selected visualization elements to the front. Use the To behind button to move them to the back.
Below the elements list there you find – depending on which element is currently selected - one of the following combinations of edit fields where you can modify size and position of the element:
- If a rectangle, rounded rectangle, ellipse, bitmap, visualization, button, or a meta file is currently selected, then next to the text "Rectangle (x1, y1, x2, y2)" there are four edit fields, where the actual x/y positions are shown and can be modified.
- If a line, polygon, or a curve is currently selected, a table will be available showing the actual X-Position and Y-Position of each of the black squares which mark the shape of the element, as soon as it is selected. These values can be edited here.
To set the modified position values in the elements list and in the visualization, press button Set rectangle (in case 1.) resp. Set polygon (in case 2.).
Use the Delete button to remove selected visualization elements.
Use the Undo and Redo buttons to undo or restore changes that have been made just as you would do with the commands 'Edit' 'Undo' and 'Edit' 'Redo' . In the dialog box, you can observe the changes that are being made.
Click on OK to close the dialog box and confirm the changes.
Use Configure to get the configuration dialog for the element
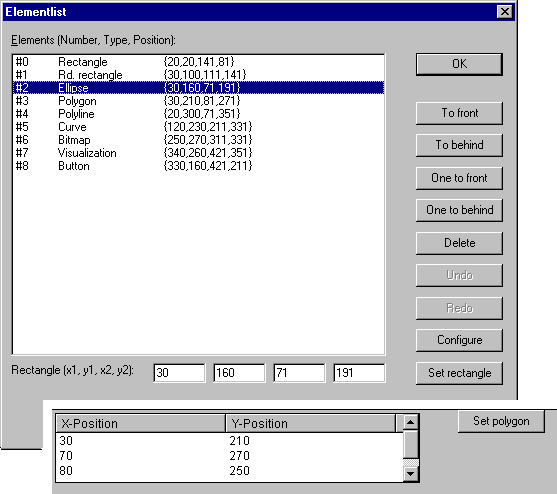 Fig.4: Dialog Elementlist
Status Bar in the Visualization
If a visualization has the focus, the current X and Y position of the mouse cursor in pixels relative to the upper left corner of the image is displayed in the status bar. If the mouse pointer is located on an Element, or if the element is being processed, then the number of the element will be displayed. If you have selected an element to insert, then this element will also appear (for example, Rectangle).