Example:
The procedure for loading measured values and constructing a correspondingly fitted characteristic curve is illustrated here.
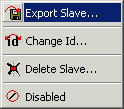
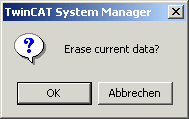
To begin with, a new slave is created under the existing master. The measured values can be read in using the Import command on the slave's properties page. Confirm with OK when asked whether the current data should be deleted.
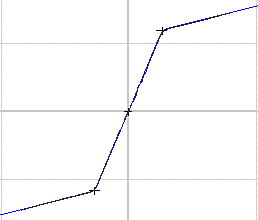
The graphic window is adjusted to match the data that has been read through the Adjust to extreme values command. The measured data is represented as a cubic spline. If the variation in the measured value is too large, this can result in overshoots in the display. This behaviour can be adjusted by manually changing the function type in the table.
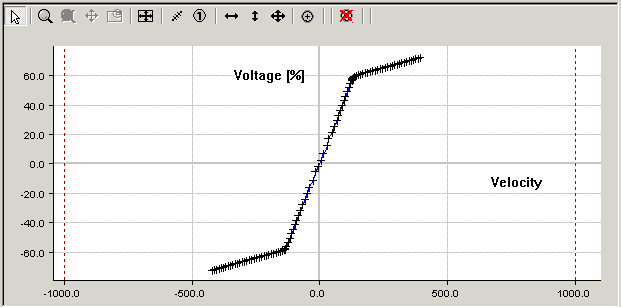
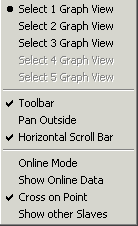
The user either now inserts a new slave for the characteristic curve or changes to the existing slave that he wants to modify. The measurements are shown in the background using the Show other Slave command (right mouse button in the graph).
It is now possible to shift the points and zoom the display in order to adapt the current curve to the measurements. As a rule, the measurements do not fill the full range of the characteristic curves, so that the current curve extends beyond the measured values.
If a number of measurements are available, it is possible to store each in a separate slave, and to use the Disabled command in the tree view to hide those not required at the moment in the background of the view.