Introduction
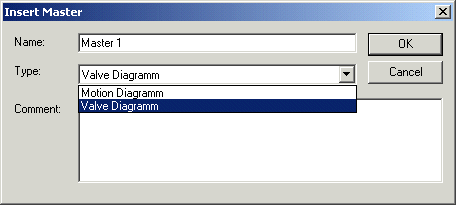
A graphically oriented editor, similar to the cam plate editor, is used to develop the characteristic curve for a hydraulic valve. The Valve Diagram Editor integrated into TwinCAT can be found in the System Manager under the Tables item in the NC Configuration. After choosing Tables in the tree view, the right mouse button can be used to select the Append Table command, and the type of the master can then be selected in the Insert Master window. The Valve Diagram Editor is chosen by selecting Valve Diagram.
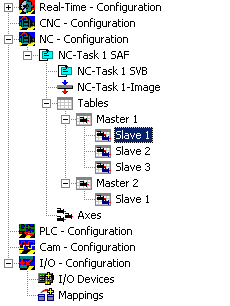
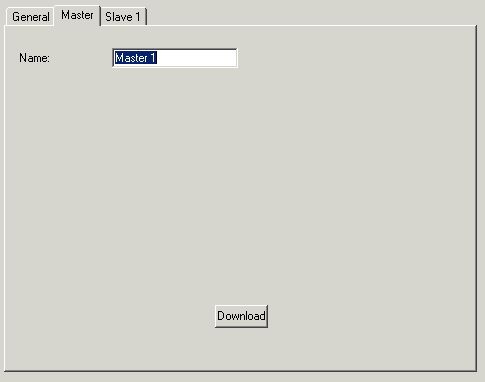
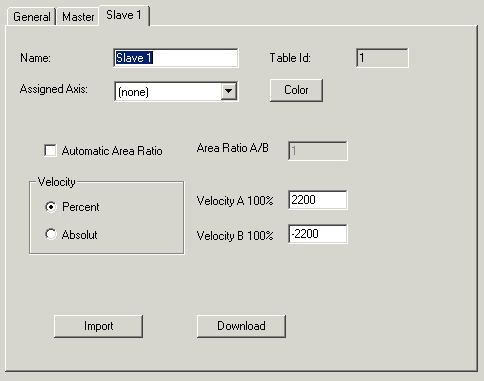
Appropriate slaves can be inserted (with the right mouse button) under this. If you then click the master in the tree, the properties pages can be used to set the properties not only of the master, but also of the associated slaves. The structure of master and slave originates in the camshaft editor. Its advantage here is that measurements can be placed into a separate slave, and that these can then be used as a graph in the background for the construction of an idealised characteristic curve.
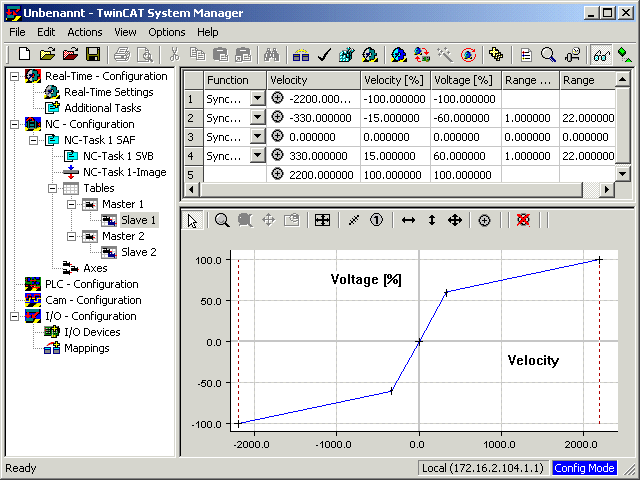
The user's interface to the Valve Diagram Editor is largely graphical. Following interactive graphic entry of the points in the graphic window, the co-ordinates of the points are displayed in the table window above it. New points can only be inserted in the graph, and it is only possible to delete existing points via the graph. The properties of the points - the co-ordinate values - can also be interactively manipulated in the table window. The points are usually joined to one another by straight lines. The transitions between the straight lines are smoothed by entering a range for the transition (Range). The range can only be modified through the table window.
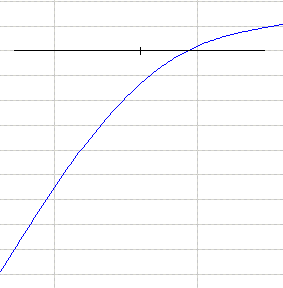
The cross that displays the intersections of the straight lines
is adapted horizontally to the range.
The graphic area allows display not just of the voltage against the
velocity, but also of their derivatives.
The mode of the display can be changed by a right mouse click in
the graphic window, which opens the following menu:
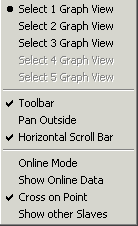
Thus a separate graphic window is opened for each derivative.