Online tab
 | Online View The task must be downloaded and activated on the target system to enable online display of task values. |
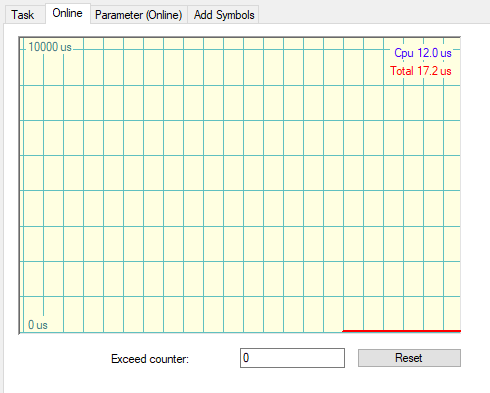
CPU display | The curve records the pure CPU time that was needed for the execution of the task. |
Total display | The curve records the time that has elapsed between the start and end of task execution. The difference between pure CPU execution time and absolute (total) execution time can result, for example, from an interruption of the task by tasks that have a higher priority or by Windows. |
Exceed counter | The number of times the task has exceeded the cycle time is counted in the Exceed counter. |
Reset | Resets the Exceed counter to zero. |
Online
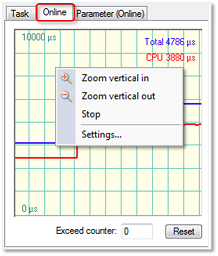
Zoom vertical in | Enlarges the view. |
Zoom vertical out | Reduces the view. |
Stop | As long as this option is active, the recording of the curve is stopped. |
Settings | Opens the History Settings dialog. |
History Settings
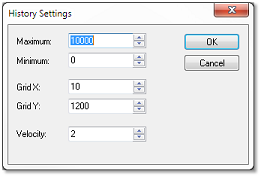
Maximum | Defines the maximum value for the History Trace View (upper row). |
Minimum | Defines the minimum value (bottom row). |
Grid X | Defines the grid scaling of the time axis (horizontal). Default value is "10". |
Grid Y | Defines the vertical grid scaling of the Trace View. Maximum / Grid Y = Number of vertical fields Example: Maximum value = 100000, Grid Y value = 20000 => 5 vertical fields are displayed. |
Velocity | Sets the feed rate of the trace. The default velocity is "2". |
OK | Saves the changes and closes the dialog. |
Cancel | Closes the dialog without saving the changes. |