Memory View tab
In the Memory View tab, all active memory pools of the selected target system are displayed in the Available Memory Overview table. The table contains the name, the size, the number of allocations currently available for the system and a status display for the memory still available. Individual or multiple pools can be selected in the first column. This activates the other display elements in the tab for monitoring.
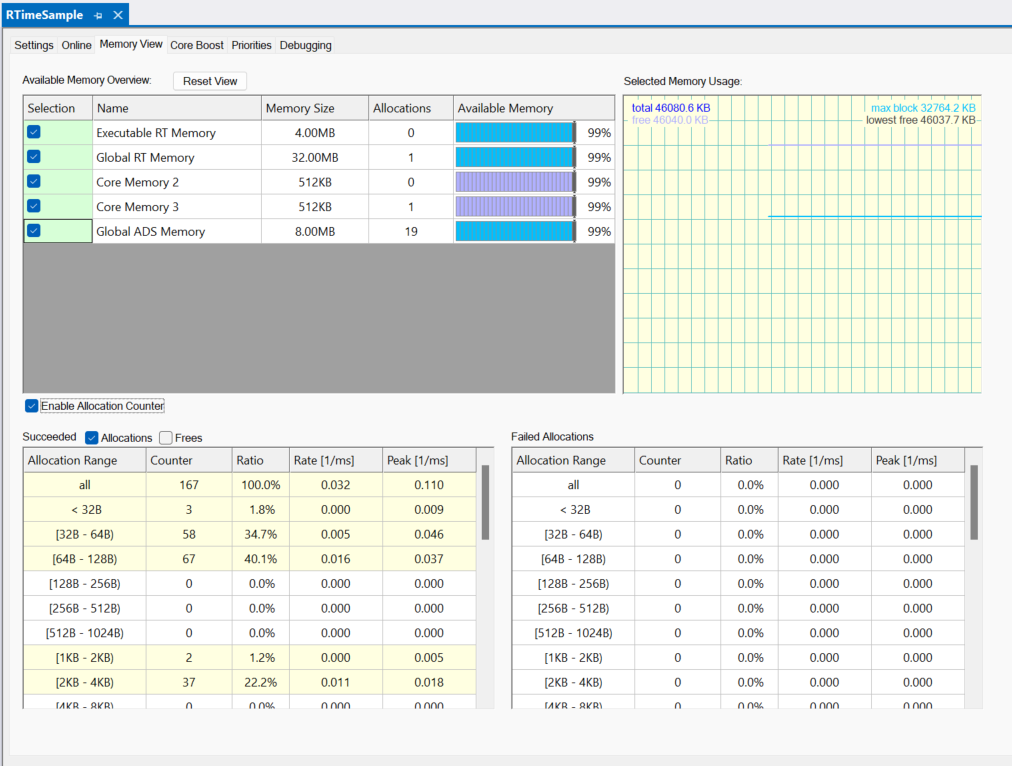
In the Selected Memory Usage graphical display, the sum of the memories selected in the table is displayed graphically.
dark blue graph | Total memory |
purple graph | Available memory (sum of all free memory blocks) |
light blue graph | Size of the largest free memory block in one of the selected memories. |
black graph | Minimum size of available memory blocks measured over the runtime. The value is updated after each allocation from the start of TwinCAT. Re can be reinitialized by "Reset View" ("Worst Case" memory). |
The colors of the bottom 3 rows apply both to the display as a graph in the diagram and to the color of the bars in the status display of the table. The length of the light blue bar in the status display therefore shows the maximum contiguous available memory. The purple bar shows the sum of all freely available memory blocks and the black bar shows the size of the "Worst Case" memory.
Checkboxes for selecting the display of memory allocations:
Enable Allocation Counter | Enables the memory allocation counter. If this option is enabled, the tables shown in the view above are displayed for the memory allocations or frees. A table of failed allocations is also displayed. |
Succeeded | |
Allocations | If activated, successful memory allocations are counted. |
Frees | If activated, the successful frees are counted. |
If both checkboxes are active (successful allocations and frees), the difference between allocations and frees is displayed.
 | The tables showing allocations and frees or failed allocations also refer to the storage pools selected above. |
The first line of the tables shows the total of all allocations / frees or failed allocations. The following lines contain the counters depending on the requested size.
The columns show the allocation sizes, the number of allocations and the proportion of all allocations (successful and failed allocations). The counters for allocations per ms and their peak value are also displayed. The last two values are average values, i.e. 1 allocation per ms can also mean that 10 allocations are carried out every 10 ms within a cycle. The tables and counters are reset to 0 by Reset View.