Configuration of a histogram
The following section explains the configuration of a histogram, based on an example.
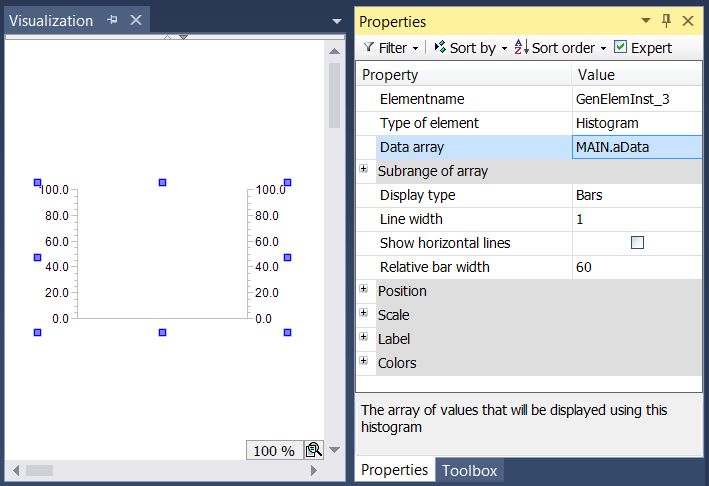
The assigned data array – in the example an array with the name "aData" – must be specified in the element properties of the histogram element. The  button is available after clicking in the input field of the "Data array" property. It can be used to search for the variable in the project. Be sure to specify the input variable with its full path in the device tree.
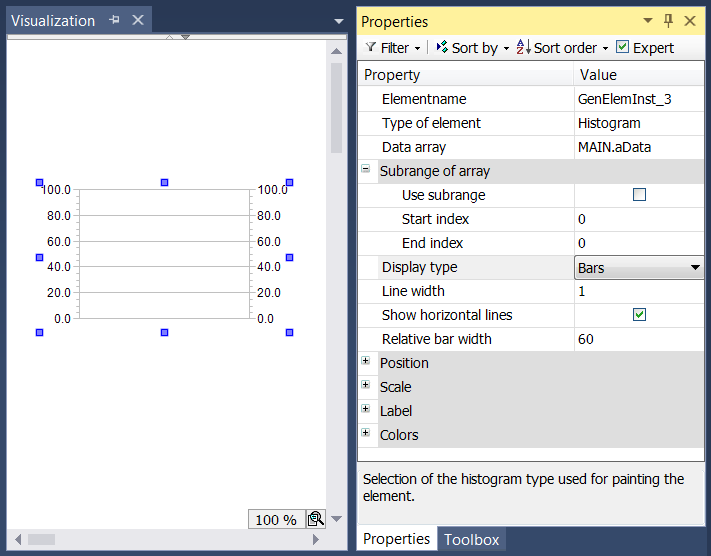
The option "Use subrange" is used if not all elements of the arrays are to be displayed, but only the elements from "Start index" to "End index". In addition, the display type of the array data can be shown in three different forms:
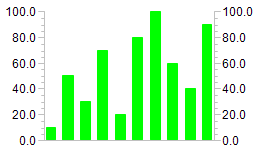
Bars |
|
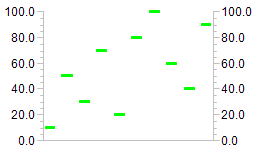
Lines |
|
Curve |
|
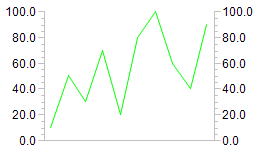
In this histogram example, horizontal lines are drawn at the main scales.
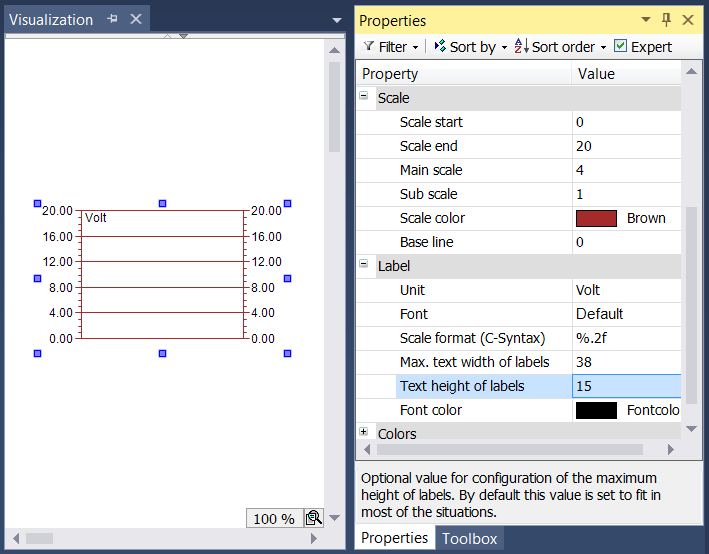
In the scale properties the numeric range of the scale and the main and sub scales can be defined. The scale range is limited by the values specified in "Scale start" and "Scale end". The value of "Scale start" must therefore be lower than that of "Scale end". The values for Main scale and Sub scale can be set to 0, in order to disable the display of the scale lines: if the value for the main scale is set to 0, no sub scale lines are drawn, irrespective of the value set for the sub scale. If the value for the sub scale is set to 0, so, only the scale lines for the main scale are drawn. To change the scale color, click on the field for the scale color. A dialog opens, in which the color can be selected.
The scale display can be specified in the Label section. The entry in the input field Unit is intended for specification of the scale unit. It is displayed at the top left of the histogram. After selecting a suitable font and font color, the label format can be adjusted. The formatting of the numerical values must be specified according to the syntax the C programming language. Use "%d" for integer values and "%.Xf" for floating-point numbers, whereby "X" should be replaced by the required number of decimal places.
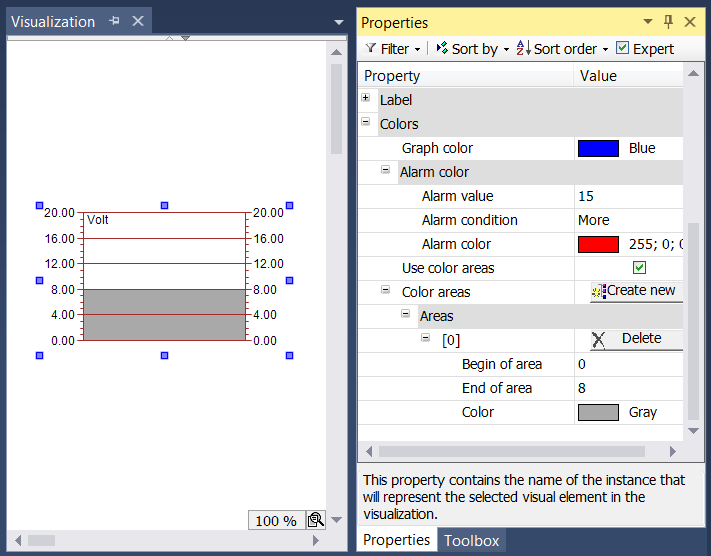
Finally, the element color can be specified in the ‘Alarm color’ section. First, select the color for the histogram. Within the subsection "Alarm color" an alarm color can be defined in which the individual bar is displayed, if the current value of the array element meets the alarm condition. This condition results from the definition of the alarm value, which must either not be exceeded (if the alarm condition is set to "More"), or the value must not fall below a minimum value (if the alarm condition is set to "Less").
Subareas of the scale can be assigned a certain color by creating a color area with the  button. The color areas are numbered in ascending order. Each color area is assigned its own input fields within the element properties.
The limits of the subarea can be specified under "Begin of area" and "End of area". The color can be selected via a pull-down menu. Once a color area has been created, it can be deleted by clicking on the corresponding  button.