Configuration of a bar display
The following section explains the configuration of a pointer instrument, based on an example.
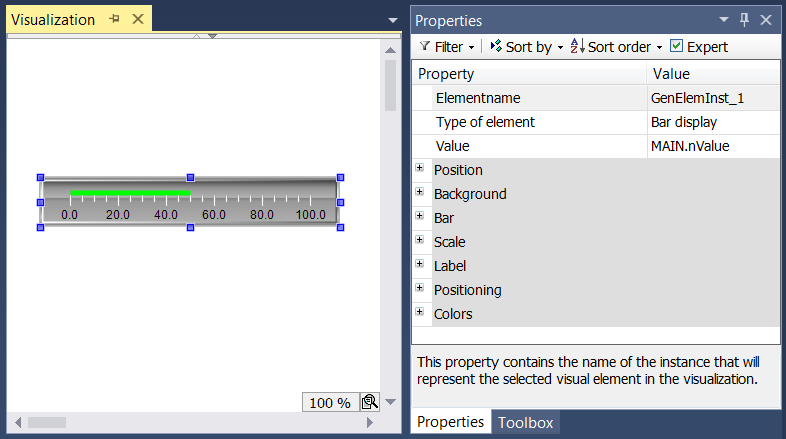
The input variable to be linked – in the example a variable with the name "nValue" – must be specified in the element properties of the ‘Bar display’. After clicking in the input field for the property "Variable" the button  is available, which can be used to browse for the variable within the project.
The orientation and position of the bar relative to the scale can be set in the "Bar" section.
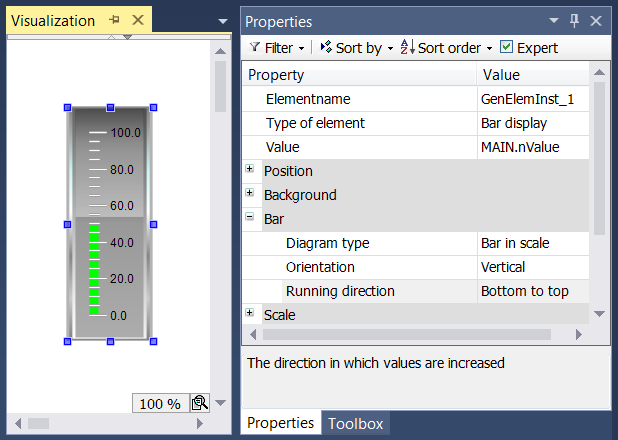
In the example the bar orientation was changed from "Horizontal" to "Vertical" by changing the aspect ratio from width to height. This setting also changes the possible information for the "Running direction". Instead of "left to right" or "right to left", you can now choose between "bottom to top" or "top to bottom". The position of the bar relative to the scale can be determined by setting the "Diagram type".
The "Scale" section is intended for setting the range of the scale and the main scaling and the subscaling.
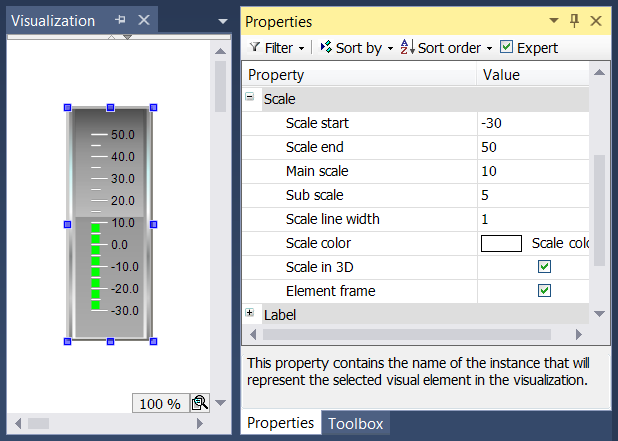
The scale range is limited by the values specified in "Scale start" and "Scale end". The value of "Scale start" must be lower than that of "Scale end". The values for "Main scale" and "Sub scale" can be set to 0, in order to disable the display of the scale lines. If the value for the main scale is set to 0, no scale lines are drawn, irrespective of the value set for the sub scale. If the value for the sub scale is set to 0, only the scale lines for the main scale are drawn. The "Element frame" checkbox is ticked, because in the example we want a frame drawn around the element.
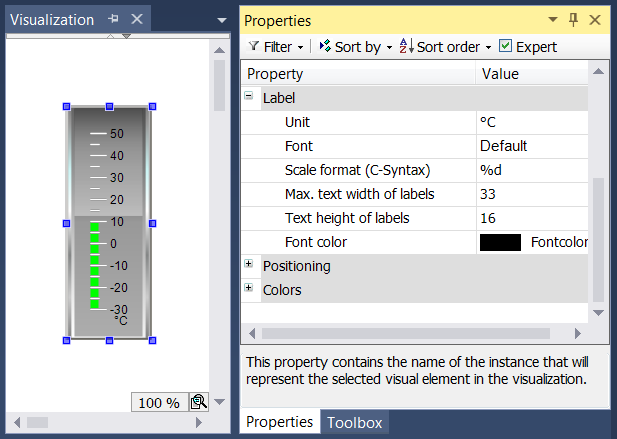
The "Label" section is used for specifying the bar label properties. The "Unit" entry is used to specify the unit. It is displayed centered below the bar. Once a suitable font and font color has been selected, the label format can be adjusted. Numerical values must be specified according to the C syntax. Use "%d" for integer values and "%.Xf" for floating-point numbers, whereby "X" should be replaced by the required number of decimal places.
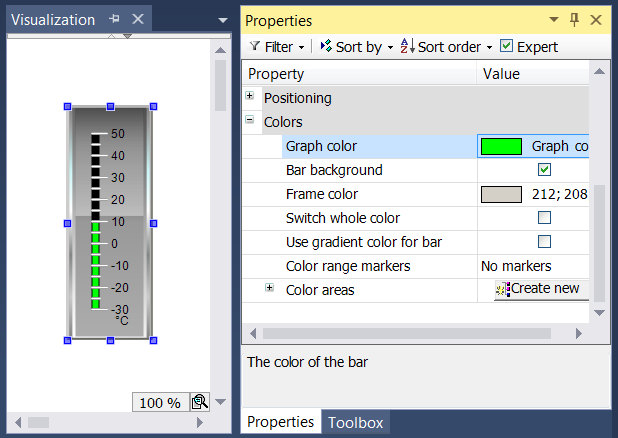
Finally, the element color can be specified in the "Colors" section. First, the color of the bar itself can be specified under "Graph color". By default no bar background is drawn. This is the part of the bar line that is currently not filled by the bar. If the "Bar background" checkbox is ticked, the non-filled part of the bar is shown in black.
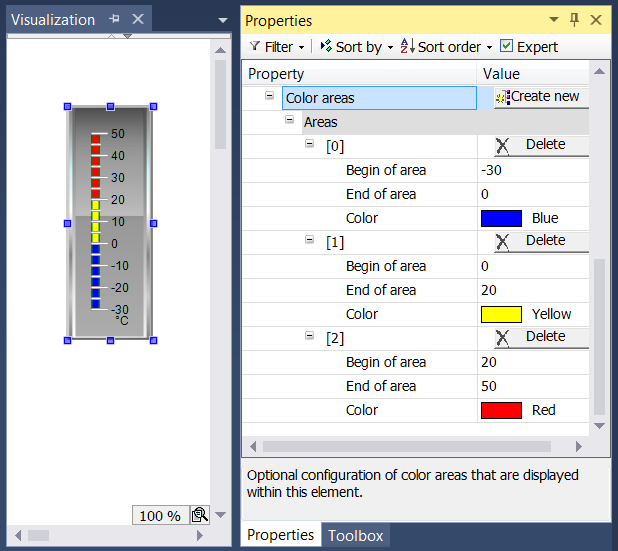
Within "Color areas" subsection, the scale can be subdivided into subareas. Each subarea can be assigned a certain color by creating a color area with the  button. The color areas are numbered in ascending order. Each color area is assigned its own input fields within the element properties.
The limits of the subarea can be specified under "Begin of area" and "End of area". The color can be selected via a pull-down menu. Once a color area has been created, it can be deleted by clicking on the corresponding  button.