Display of signal curves
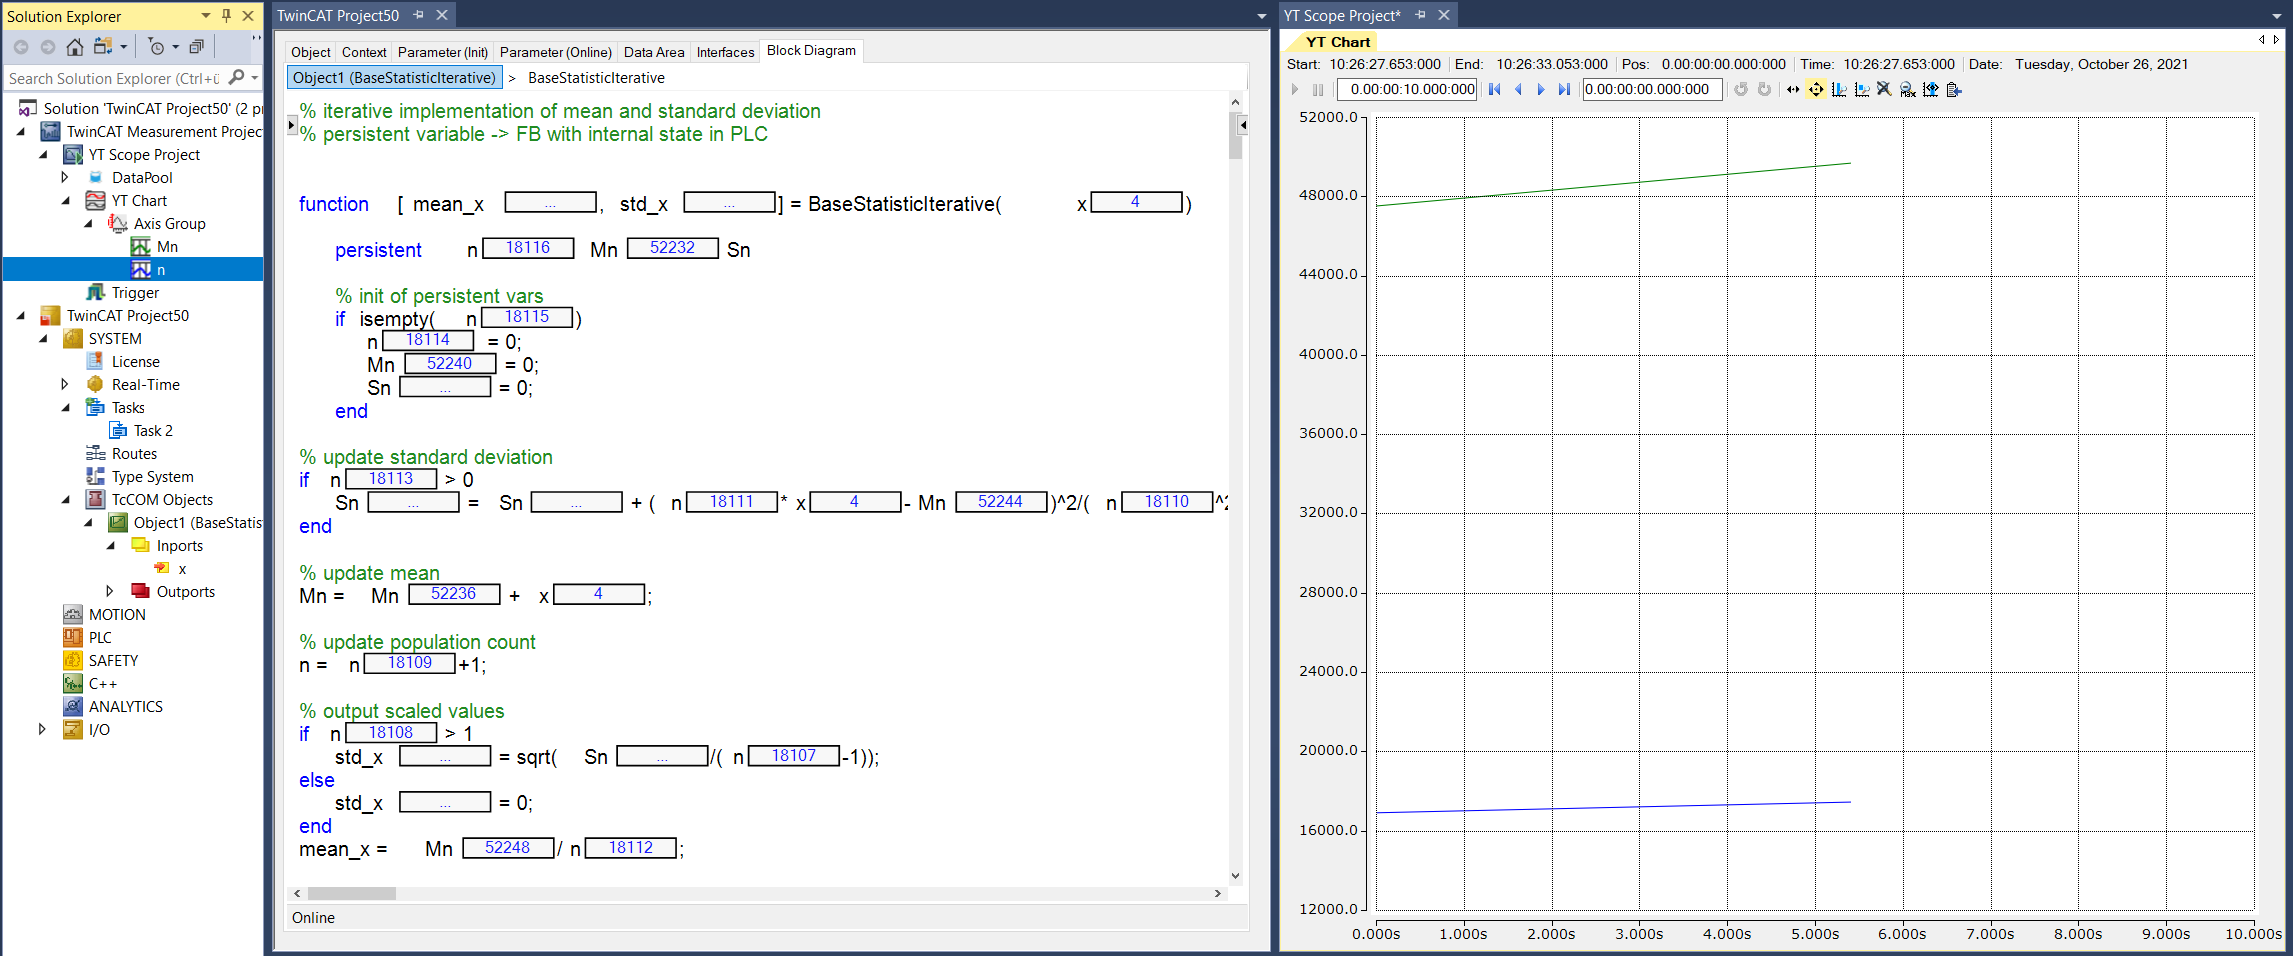
Selected variables can be retrieved in TwinCAT XAE via ADS. It is therefore possible to display them in a mini-scope within the block diagram, or with the TwinCAT Scope within a measurement project.
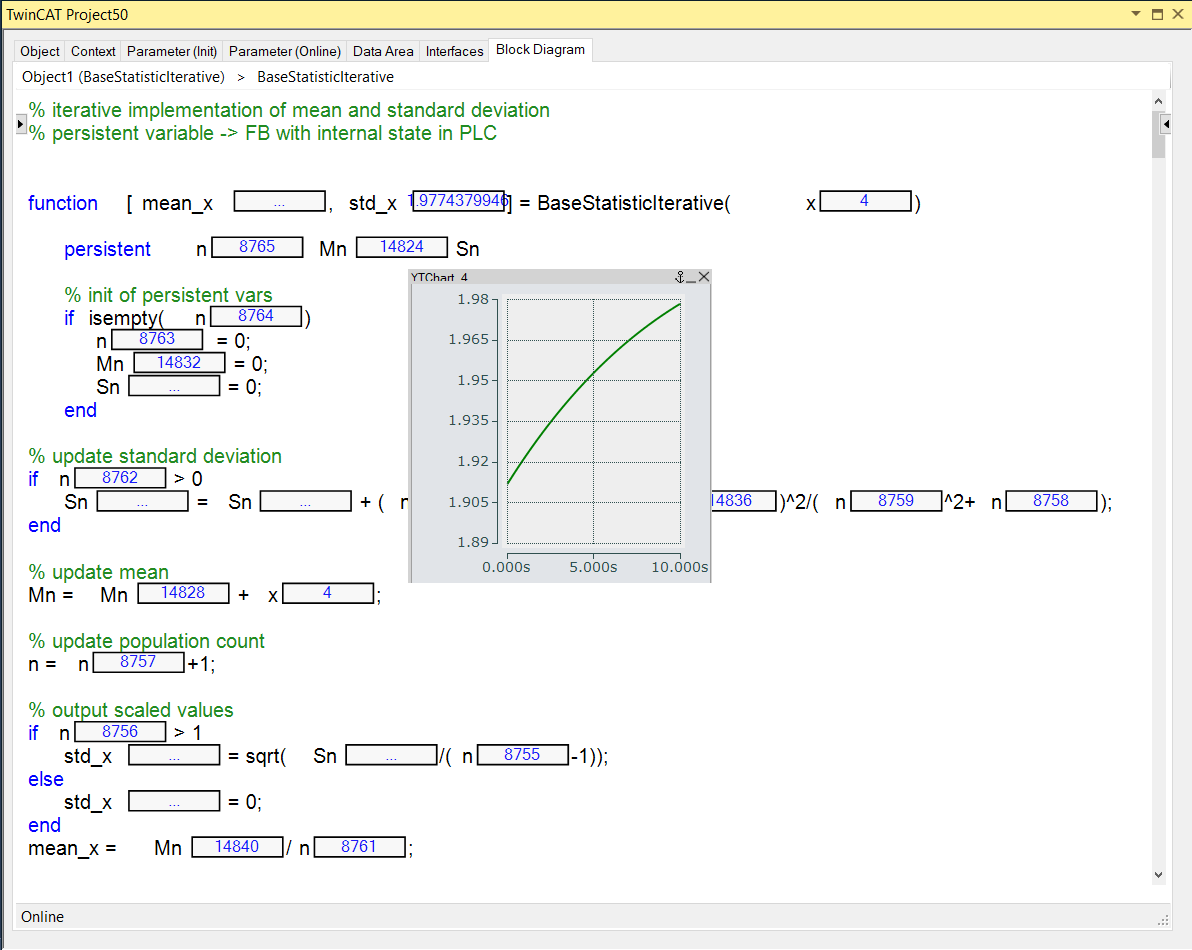
Variables that can be displayed in scope have a trailing black frame in the code display. In this frame, the values are displayed in blue during operation.
Drag&Drop a "blue variable" onto the block diagram window to open a Mini.Scope.
By dragging and dropping a "blue variable" onto the Axis Group of a chart in the TwinCAT Measurement project, the variables are added to the TwinCAT Scope.
Which variables are visible as "blue variables" in TwinCAT XAE?
- The input variables
- The output variables
- Persistent variables (MATLAB definition
persistent var1 … varN)