Distributed Clocks Slave Diagnosis

|
1
|
SYNC to SoF.
|
|
2
|
SoF to SYNC.
|
|
3
|
EoF to SYNC.
|
|
4
|
EoF to PDI.
|
|
5
|
SYNC to PDI.
|
|
6
|
PDI to SYNC.
|
|
7
|
PDI to SoF.
|
|
8
|
PDI Access.
|
|
9
|
SoF to EoF.
|
SoF
Start of Frame: The first bit of a frame that reaches the ESC EtherCAT Processing Unit.
EoF
End of Frame: The last bit of a frame that leaves the ESC EtherCAT Processing Unit.
SYNC
A synchronous event triggered by the DC unit after the system time.
PDI
The local host controller accesses the ESC DPRAM via the PDI (process data interface).
Distributed Clocks Slave Diagnosis
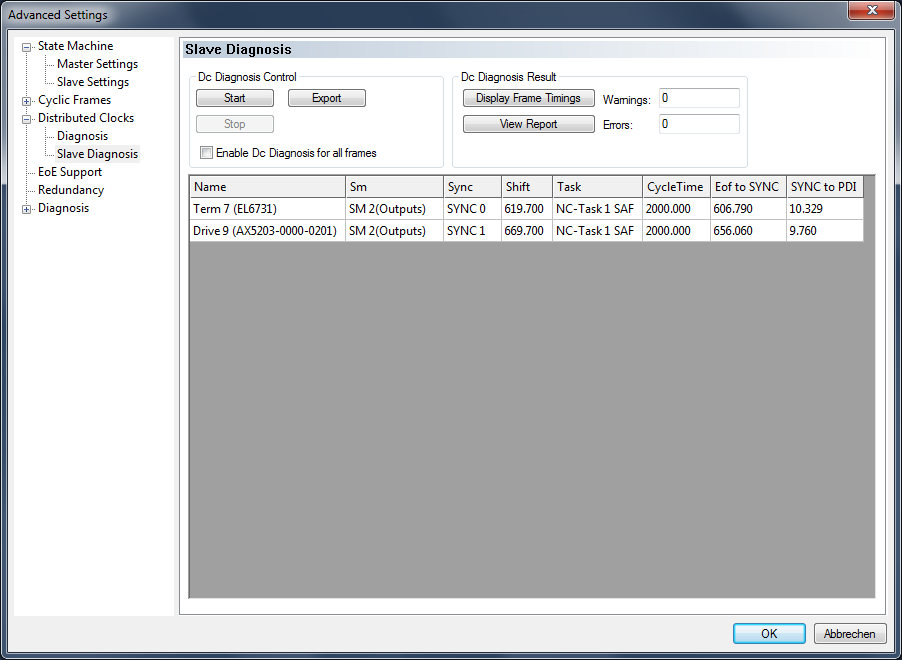
Dc Diagnosis Control
Start:
Pressing the "Start" button starts a measurement for DC diagnosis.
Stop:
Pressing the "Stop" button stops a measurement for DC diagnosis.
Export:
The results of the DC diagnosis measurement can be saved in a Dc Diagnostics XML file using the "Export" button.
Enable Dc Diagnosis for all frames:
The DC diagnosis is only performed if at least one DC frame is present, i.e. a frame that addresses a device that uses distributed clocks functionality as a DC device. The existing frames and their datagrams are listed in a table in the dialog with the EtherCAT tab. If the "Enable Dc Diagnosis for all frames" checkbox is not checked, the DC diagnosis is only performed for the first DC frame in the table. If the "Enable Dc Diagnosis for all frames" checkbox is checked, DC diagnosis results for all existing DC frames are determined and displayed.
Dc Diagnosis Result
Display Frame Timings:
The "Display Frame Timings" button opens the "EtherCAT Dc Cyclic Diagnosis" dialog box, which graphically illustrates the measurement results.
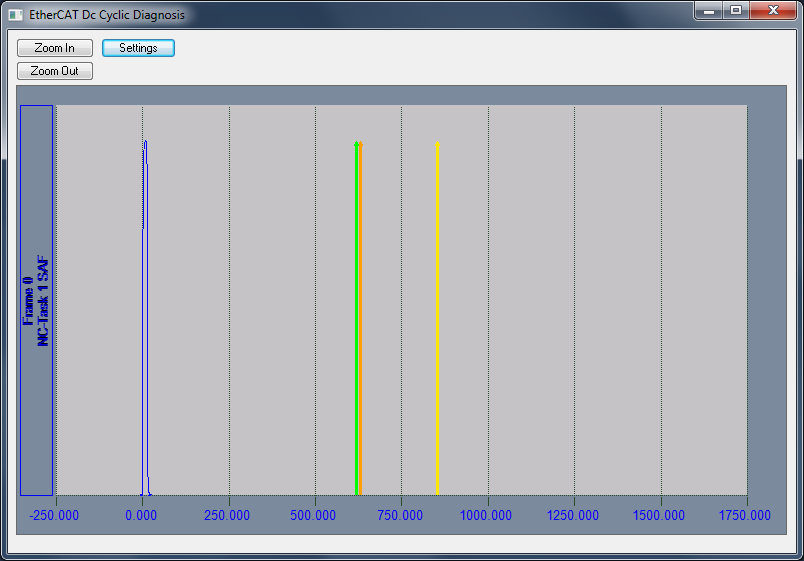
Zoom In
Zooms in on the time axis by a factor of 2.
Zoom Out
Zooms out of the time axis by a factor of 2.
Blue signal
Start of Frame, Frame, End Of Frame.
Signal arrows
A tooltip text provides information about the signals displayed as an arrow.
Green signal arrow
Outputs DC Sync.
Orange signal arrow
Output PDI Access.
Yellow signal arrow
Input PDI Access.
Settings
The "Settings" button opens the "Settings" dialog.
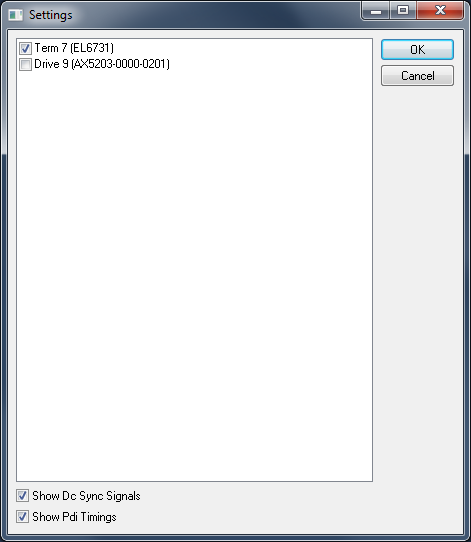
Settings: Show Dc Sync Signals
If the checkbox is checked, the "Outputs DC Sync" signals are displayed.
Settings: Show Pdi Timings
If the checkbox is checked, the signals "Output PDI Access" and "Input PDI Access" are displayed.
Settings: OK
Applies the new settings and closes the dialog.
Settings: Cancel
Closes the dialog without applying the new settings.
Settings: Term 7 (example)
If the checkbox is checked, the signals from terminal 7 are displayed.
Settings: Drive 9 (example)
If the checkbox is checked, the signals from drive 9 are displayed.
View Report:
The "View Report" button opens the "EtherCAT Dc Cyclic Diagnosis Report" dialog, which displays errors and warnings.
Warnings:
The "Warnings" text box shows the number of warnings resulting from the diagnosis.
Error:
The "Error" text box shows the number of errors resulting from the diagnosis.
Table
Name:
The "Name" column of the table shows the names of the different devices (one per row), which use distributed clock functionality as DC device and are addressed by the frame that serves as the basis for the DC diagnosis in the respective table row.
Sm:
The "Sm" column shows the Sync Manager assigned to the DC device in the respective table row.
Sync:
The synchronizing sync signal is entered in the "Sync" column.
Shift:
The "Shift" column contains the SYNC shift time for outputs or the SYNC shift time for outputs plus a reserve time in microseconds.
Task:
In the "Task" column, the name of the task is displayed that sends the frame that serves as the basis for the DC diagnosis in the respective table row.
CycleTime:
In the "CycleTime" column, the cycle time of the synchronizing task is displayed in microseconds. The cycle time corresponds to the time interval from the "Start of Frame (SoF)" to the next "Start of Frame (SoF)", if jitter is ignored.
Eof to SYNC:
In the "EoF to Sync" column, the time interval from the "End of Frame (EoF)" to the SYNC signal is displayed in microseconds.
SYNC to PDI:
In the "SYNC to PDI" column, the time interval from the SYNC signal to the beginning of the mapping of the process data interface (PDI) is displayed in microseconds.