Topology dialog
To open the Topology dialog, select the master device in the IO tree and the corresponding EtherCAT network whose topology you want to display. Select the "EtherCAT" tab and click the "Topology…" button to open the Topology dialog.
The topology view shows the topology of the EtherCAT network belonging to the selected master device. The states of the individual devices during operation can be displayed. Errors that have become apparent through the cyclic redundancy check are marked near the affected ports. The Topology dialog is intended to help identify errors in the system so that they can be corrected quickly.
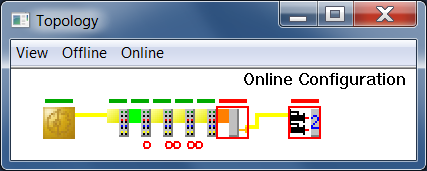
The Topology dialog has its own menu bar with the entries "View", "Offline" and "Online". Use the "View" menu item to set a zoom factor for the selected topology. The zoom factors available for topology of the EtherCAT network are 1, 1.5 and 2. The topology of the EtherCAT network can be displayed "Offline", as configured. The topology of the EtherCAT network can also be displayed "Online", as it is configured and running.
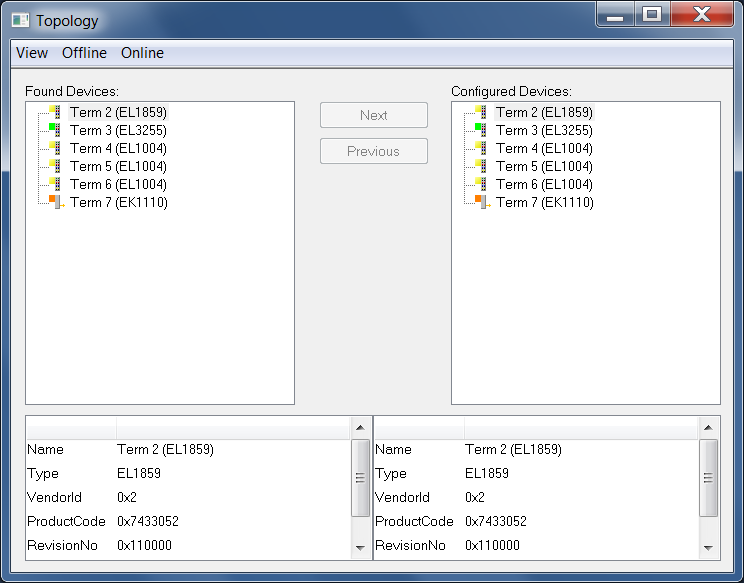
The "Compare with" entry under "Online" opens a submenu with the "Found Devices" entry. Click "Found Devices" to open a dialog that compares the devices found with the configured devices. The devices found and the configured devices are shown in a list. If you select a device in the respective list, the name, type, vendor ID, product code and revision number of the device are displayed in a list field below the list.
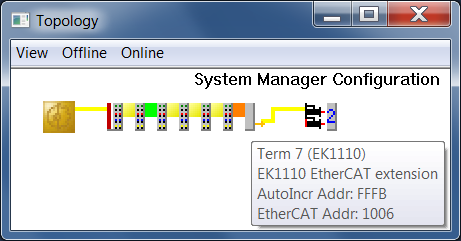
Click on "Show Topology" in the "Offline" menu item to return to the configured topology. If you move the mouse over a device, a tooltip opens. It displays the name, the type, the auto-increment address and the EtherCAT address of the device.
Click on "Show Topology" in the "Online" menu item to show the online topology. Above each device there is a colored line. It indicates the state of the EtherCAT state machine for the respective device.
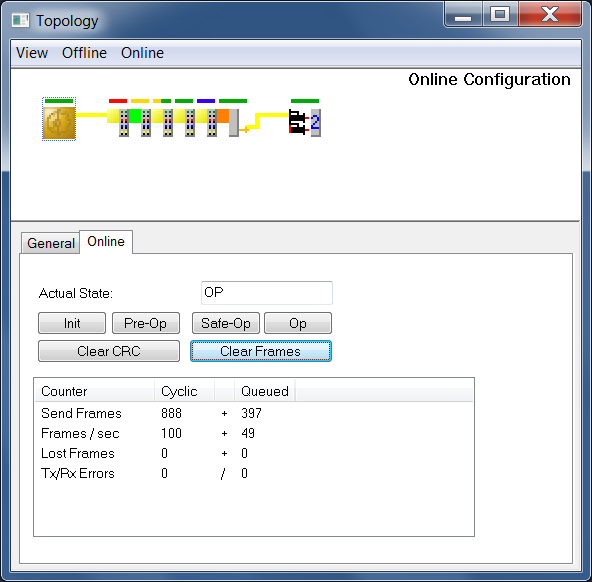
The image shows one EtherCAT master device, six EtherCAT slave devices and one drive driving two motors. The first terminal behind the master, the EK1200 EtherCAT power supply unit, is not displayed in the online view. The first device shown in the online view is the EL1859 terminal with eight digital inputs and eight digital outputs, followed by the EL3255 terminal with five channels for potentiometer measurement with sensor supply, followed by three EL1004 terminals with four digital inputs each and finally the EK1110 terminal, an EtherCAT extension. The EtherCAT extension integrates the drive component into the topology.
The state symbol, a colored line above the master device, is green. The master is in the "Operational" state. The state symbol above the EL1859 terminal is red; the slave device is in the "Init" state. A continuous orange state symbol is shown above the EL3255 terminal; the terminal for potentiometer evaluation is in the "Pre-Operational" state. The state symbol above the first of the three terminals with four digital inputs is half orange and half green. The terminal is in the "Safe-Operational" state. The two colors, orange and green, for the "Safe-Operational" state symbolize that the "Safe-Operational" state is between the "Pre-Operational" and "Operational" states. A state transition from "Pre-Operational" to "Operational" is not possible directly, but a direct state transition from "Operational" to "Pre-Operational" is possible. The state symbol above the terminal in the middle of the three EL1004 terminals is solid green. The terminal is in the "Operational" state. The terminal on the right of the three EL1004 terminals is under a blue state symbol. It is in "Bootstrap" state. The sequence of the states in the image serves is for illustration purposes. It does not represent a normal operating state.
The EtherCAT master is selected in the image, indicated by a dotted frame. The "General" tab shows the name of the master and his ID. Each EtherCAT master device has its own identification number. The current state of the master is shown on the "Online" tab. It is in the "Operational" state. The "Init", "Pre-Op", "Safe-Op" and "Op" buttons can be used to set the states with these names. The table shows the number of transfer frames sent. It indicates how many frames are sent per second and how many frames have been lost. The bottom row in the table indicates how many errors occurred during sending and receiving. The "Clear Frames" button resets the number of sent frames to zero.
Right-click the master device or a slave device within the topology view to open a context menu that allows you to request the "Init", "Pre-Op", "Safe-Op" or "Op" state for the respective device.
If you select an EtherCAT slave device, the three tabs "EtherCAT", "Online" and "Process Data" are displayed. On the "EtherCAT" tab, the name of the slave device, its type, its EtherCAT address and its auto-increment address are displayed as configuration information. The product identification information comprises the vendor ID, revision number, product code, serial number and the product and its revision number.
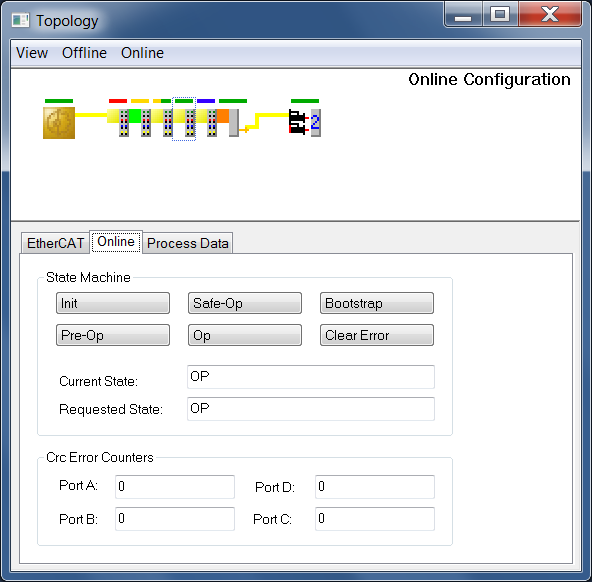
On the "Online" tab there are five buttons for setting the state of the EtherCAT slave device. Using these buttons, the EtherCAT slave device selected in the Topology view can be set to one of the states: "Init", "Pre-Op", "Safe-Op", "Op" and "Bootstrap". The current state and the requested state are displayed. If the slave device is in the "Init" state and the "Op" state is requested, the slave device then passes through the "Pre-Op" and "Safe-Op" states before reaching the "Op" state.
The "Process Data" tab lists the process data of the respective slave device. The name of the variable, its type, its size and its online value are assigned to the respective channel of the slave device. Right-click to write or force variables.
The "Clear CRC" button is located on the "Online" tab of the master dialog. The "Clear CRC" button can be used to reset the counters for errors that have become apparent as a result of the cyclic redundancy check. Our example network has a line topology. In "Run" mode, we disconnect the contact for a terminal and thus also for the terminals after it. The terminal separated from the contact and the devices after it in the line are shown in red outline in the Topology view because they are no longer accessible via the bus. The "Init" state is requested for the devices with a red border. Their current state is called "INIT NO_COMM". After disconnecting and reconnecting the terminals, the "Rx Errors" counter has probably been incremented. The reconnected terminals return to the "Operate" state.
Notice | |
Energized devices Energized devices may not be removed from their group. |
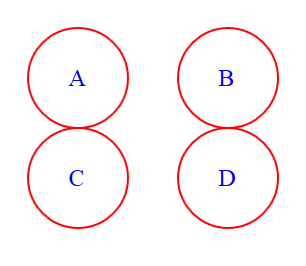
Unfilled red circles in the Topology view below the slave devices indicate the presence of errors that have become apparent through the cyclic redundancy check. If at least one error has occurred at port A, then there is a red circle on the left below the device; if at least one error has occurred at port B, then there is a red circle on the right below the device. Error at port C is indicated by a red circle below the circle which would indicate error at port A. Error at port D is indicated by a red circle below the circle which would indicate error at port B. The number in the text box or tooltip belonging to the port counts the errors that have occurred and indicates how often an error has already occurred on this port. The counters for the errors that have become apparent as a result of the cyclic redundancy check can be reset to zero using the "Clear CRC" button.