Debugging
TwinCAT C++ offers various mechanisms for debugging TwinCAT C++ modules running under real-time conditions.
Most of them correspond to the mechanisms that are familiar from the normal C++ development environment. The world of automation requires additional, slightly different debugging mechanisms, which are documented here.
In addition, we provide an overview of Visual Studio tools that can be used in TwinCAT 3. These were extended, so that data from the target system are displayed.
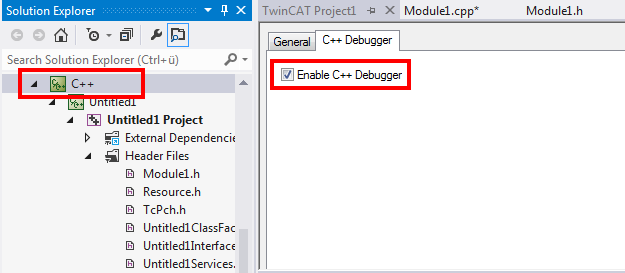
Debugging must be enabled.
This is configured via the C++ node of the solution:
- 1. Double-click on the C++ node and switch to the C++ Debugger tab to access the checkbox.
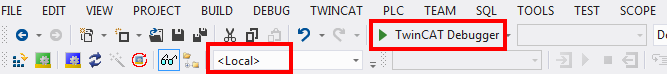
- 2. For all debugging in TwinCAT C++, connect the TwinCAT Engineering with the runtime system (XAR) via the TwinCAT Debugger button.
- 3.
Breakpoints and step-by-step execution
In most cases when debugging a C++ program, breakpoints are set and the code is then executed step by step while observing the variables, pointers, etc.
In the context of the Visual Studio debugging environment, TwinCAT offers options to run real-time-executed code step by step. To set a breakpoint, you can navigate through the code and click on the gray column on the left adjacent to the code or use the hotkey (normally F9).
| |
Damage to plants and personal injuries due to unexpected behavior of the machine / plant Breakpoints change the behavior of the machine or plant. Depending on the machine being controlled, the machine or workpieces may be damaged or the health and life of people may be endangered. Make sure that the changed behavior of the controlled system does not cause any damage and be sure to note the plant documentation. |

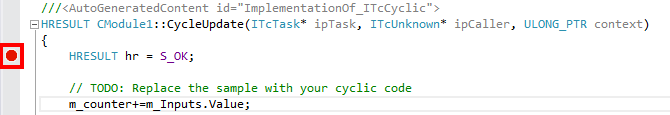
On reaching the breakpoint (indicated by an arrow), the execution of the code is stopped.
The code is executed step by step by pressing Step Over (Debug menu, toolbar or hotkey F10). The familiar Visual Studio functions Step in (F11) and Step out (Shift + F11) are also available.
Conditional breakpoints
A more advanced technology allows the setting of conditional breakpoints – the execution of code is only stopped at a breakpoint if a condition is fulfilled.
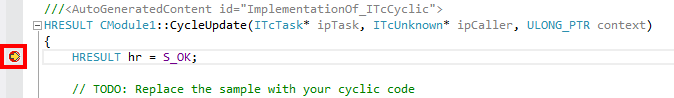
TwinCAT offers the implementation of a conditional breakpoint as part of the Visual Studio Integration. To set a condition, first set a normal breakpoint and then right-click on the red dot in the breakpoint column.
| |
Damage to plants and personal injuries due to unexpected behavior of the machine / plant Breakpoints change the behavior of the machine or plant. Depending on the machine being controlled, the machine or workpieces may be damaged or the health and life of people may be endangered. Make sure that the changed behavior of the controlled system does not cause any damage and be sure to note the plant documentation. |
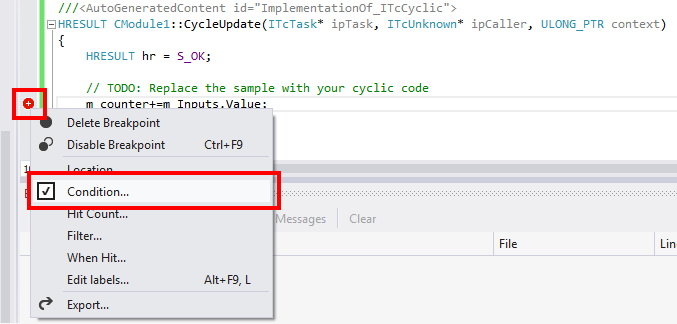
Select Condition… to open the condition window:
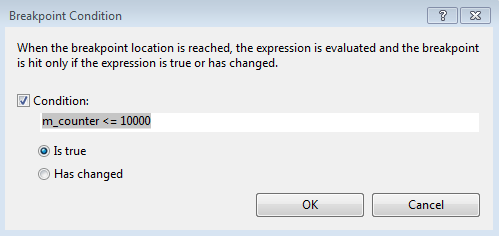
Details of the conditions and how they are to be formulated can be found here.
Live Watch
When engineering and developing machines, it is not always advisable to stop the system at a breakpoint because this will affect the behavior.
The TwinCAT PLC projects offer an online view and handling of the variables in the RUN state, without having to interrupt the real-time.
TwinCAT C++ projects offer a similar behavior for C++ code via the Live Watch window.
The Live Watch window can be opened via Debug->Windows->TwinCAT Live Watch.
To open the window, first establish a connection with the real-time system (press the TwinCAT Debugger button), whereupon Visual Studio switches to the debug view, otherwise no data can be provided.
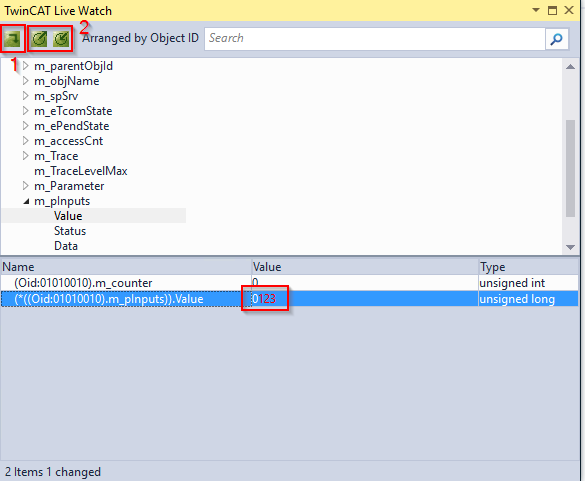
The TwinCAT Live Watch window is divided into two areas.
In the upper area all member variables can be explored. By double-clicking on it they are added to the lower area, where the current value is then displayed.
You can edit these values by clicking on the value in the Value field. The new value is highlighted in red. To write the value, press the symbol in the upper left corner (1).
Using the import and export symbols under (2), the selected member variables can be saved and later restored.