Visual Studio tools
Visual Studio makes the usual development and debugging tools available for C++ developers. TwinCAT 3 extends these Visual Studio tools, so that debugging of C++ code that runs on a target system is also possible in TwinCAT 3 Engineering with the Visual Studio tools.
The corresponding advanced tools are briefly described here. If the corresponding windows are not visible in Visual Studio, they can be added via the menu item Debug ->Windows. The menu is context-dependent, i.e. many of the windows described here only become configurable once a debugger is linked to a target system.
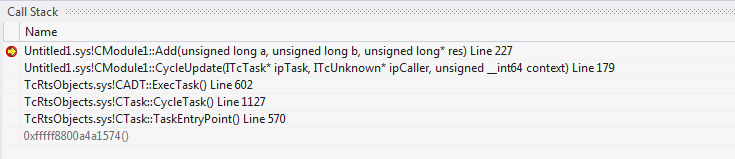
Callstack
The Call Stack is displayed by the Call Stack tool window when a breakpoint has been reached.
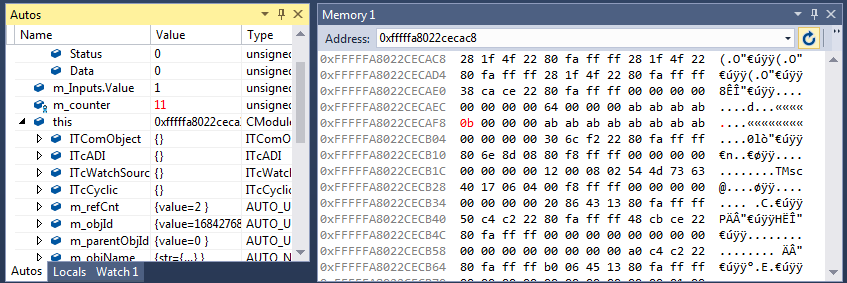
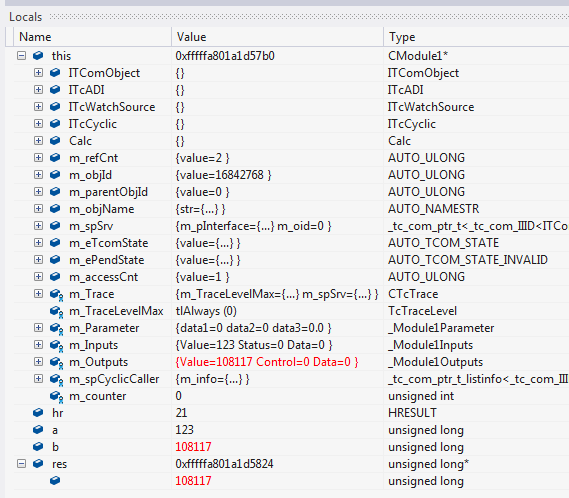
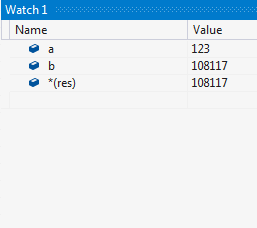
Autos / Locals and Watch
The corresponding variables and values are displayed in the Autos / Locals window when a breakpoint is reached. Changes are shown in RED.
From here, the values can be applied to the Watch windows by right-clicking:
Memory View
The memory can be monitored directly. Changes are shown in RED.