Basic function principles
Process data output format
In the delivery state, the measured value is displayed in increments of 1/10 °C in two's complement format (integer). The complete measuring range is output for each resistance sensor. Other presentation types can be selected via the feature register (e.g., signed amount representation, Siemens output format).
Measured value | Hexadecimal output | Signed integer output |
|---|---|---|
-250.0 °C | 0xF63C | -2500 |
-200.0 °C | 0xF830 | -2000 |
-100.0 °C | 0xFC18 | -1000 |
-0.1 °C | 0xFFFF | -1 |
0.0 °C | 0x0000 | 0 |
0.1 °C | 0x0001 | 1 |
100.0 °C | 0x03E8 | 1000 |
200.0 °C | 0x07D0 | 2000 |
500.0 °C | 0x1388 | 5000 |
850.0 °C | 0x2134 | 8500 |
Resistance limit values
R > 400 Ω: Bits 1 and 6 (overrange and error bits) in the status byte are set. The linearization of the characteristic curve is continued with the coefficients of the upper range limit up to the limit stop of the A/D converter (approx. 500 Ω for PT100).
R<18 Ω: Bits 0 and 6 (underrange and error bits) in the status byte are set. The smallest negative number is displayed (0x8001 corresponds to -32767).
For overrange or underrange the red error LED is switched on.
LED display
The LEDs indicate the operating state of the associated terminal channels.
Red LEDs: ERROR
- On: Short circuit or wire breakage. The resistance value is in the invalid range of the characteristic curve.
- Off: The resistance is in the valid range of the characteristic curve.
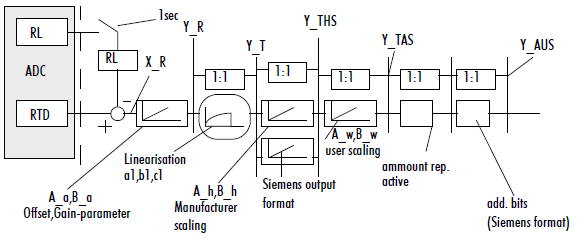
Calculation of process data
The process data that are transferred to the terminal bus are calculated using the following equations:
X_RL: |
| ADC value of the supply line |
X_RTD: |
| ADC value of the temperature sensor, including one supply line |
X_R: |
| ADC value of the temperature sensor |
A_a, B_a: |
| Manufacturer gain and offset compensation (R17, R18) |
A_h, B_h: |
| Manufacturer scaling |
A_w, B_w: |
| User scaling |
Y_R: |
| Temperature sensor resistance value |
Y_T: |
| measured temperature in 1/16 °C |
Y_THS: |
| Temperature after manufacturer scaling (1/10 °C) |
Y_TAS: |
| Temperature after user scaling |
Y_AUS: |
| Process data to PLC |
X_R = X_RTD-X_RL | (1.0) | Calculating the resistance value |
Y_T = a1 * Y_R2 + b1* Y_R + c1 | (1.2) | Linearization of the characteristic curve |
Y_AUS = Y_T | (1.4) | Neither user nor manufacturer scaling is active |
Y_THS = A_h * Y_T + B_h | (1.5) | Manufacturer scaling active (factory setting) |
Y_TAS = A_w * Y_T + B_w | (1.6) | User scaling active |
Y_1 = A_h * Y_T + B_h | (1.7) | Manufacturer and user scaling active |