Determination of the specific resistance data from a temperature curve
If the necessary data for the thermal resistance and the temperature/time constant are not given directly in the data sheet, they can also be determined via a characteristic curve as in the illustration Temperature rise with nominal load. A procedure for determining the data is to be illustrated taking the example of the following temperature/time characteristic curve.
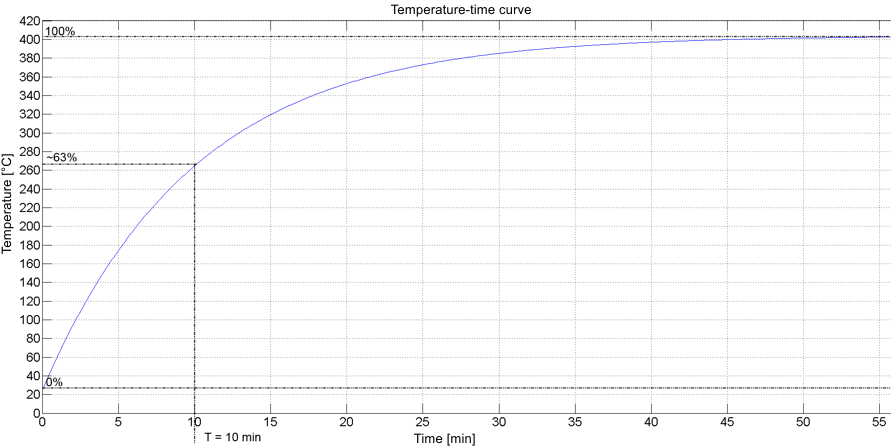
For this the difference between the maximum temperature at the rated load and the temperature without heating is determined from the diagram (0% and 100%). The thermal resistance of the resistor to the environment is then calculated as the quotient of the maximum temperature difference and the rated power.
Rth = ΔT / PNOM (1)
The thermal time constant is determined graphically from the data sheet. To do this 63 % of the difference temperature must be determined. This corresponds approximately to the temperature after the expiry of the thermal time constant. In order to determine this, a horizontal straight line of 63 % of the difference temperature added to the ambient temperature is drawn on the function graph. The thermal time constant can be determined from the intersection of the function graph with the temperature.
If no such time/temperature curve is included with the data sheet for the resistor, it can also be recorded manually. To do this the resistor is loaded with the rated power and the curve is recorded using suitable measuring devices. The measurement can be aborted as soon as it can be foreseen that the temperature is converging on a value. The current value then approximately represents the maximum temperature. With the inclusion of the rated power, the thermal resistance and the thermal time constant are determined in accordance with the procedure described above.
Guiding values of common resistors
The values listed in the table serve the fast commissioning of the EL9576 EtherCAT Bus Terminal. For a more accurate temperature simulation, however, the parameters should be precisely matched to the resistor employed.
Notice | |
Precautions for protecting the resistor when installing All data in the table are based on an installation without an additional heat sink. For the operation of the EL9576, however, an additional heat sink should be fitted in order to additionally protect the resistor against damage. |
Resistance | Figure | Dimensions [L x H x W] | Thermal resistance Rth | Time constant Tth | Comments |
|---|---|---|---|---|---|
ZB8110 |
| 110 mm x 80 mm x 15 mm | 1300 mK/W | 550 s | - |
Arcol HS50 (50 W; 10 Ohm) |
| 50 mm x 15 mm x 14 mm | 3500 mK/W | 191 s | Due to the low thermal conductivity in the core, the resistor is not suitable for high pulse powers far above the rated power |
Arcol HS75 (75 W;10 Ohm) |
| 50 mm x 25 mm x 27 mm | 3500 mK/W | 245 s | - |
TE CJT200 (200 W;10 Ohm) |
| 165 mm x 30 mm x 60 mm | 1395 mK/W | 720 s = 12 min | - |
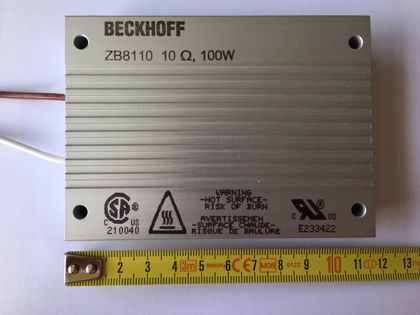
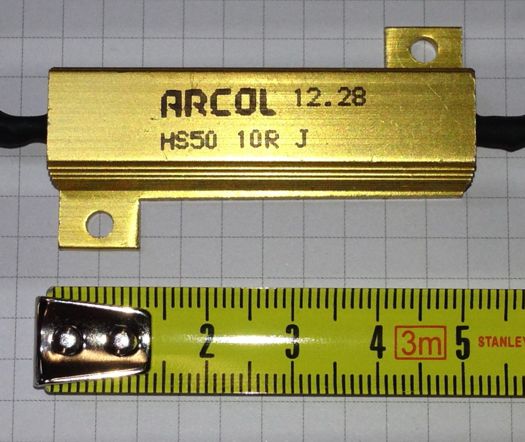
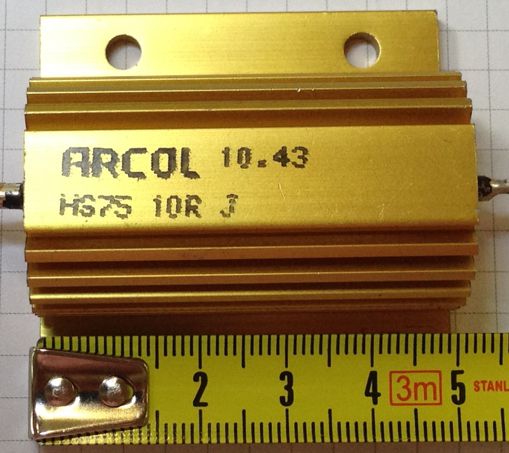
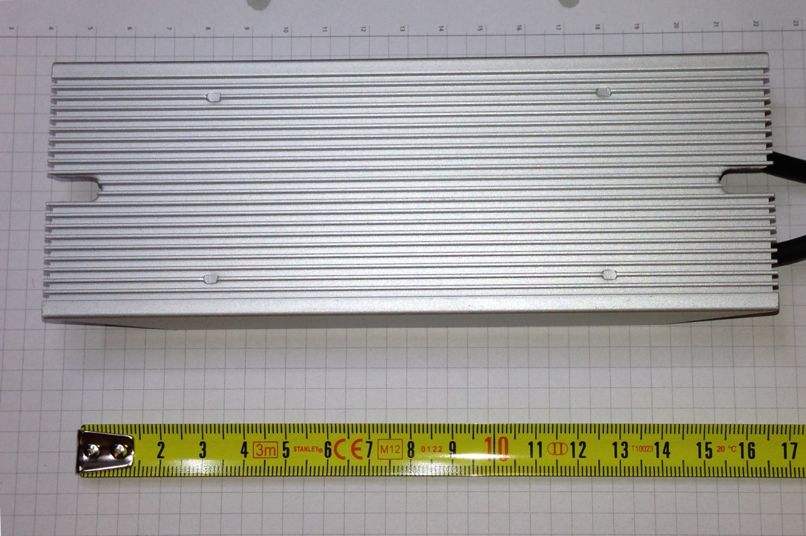
Table 1: Overview of the parameters of common resistors