Description of the function of the example program
Visualization
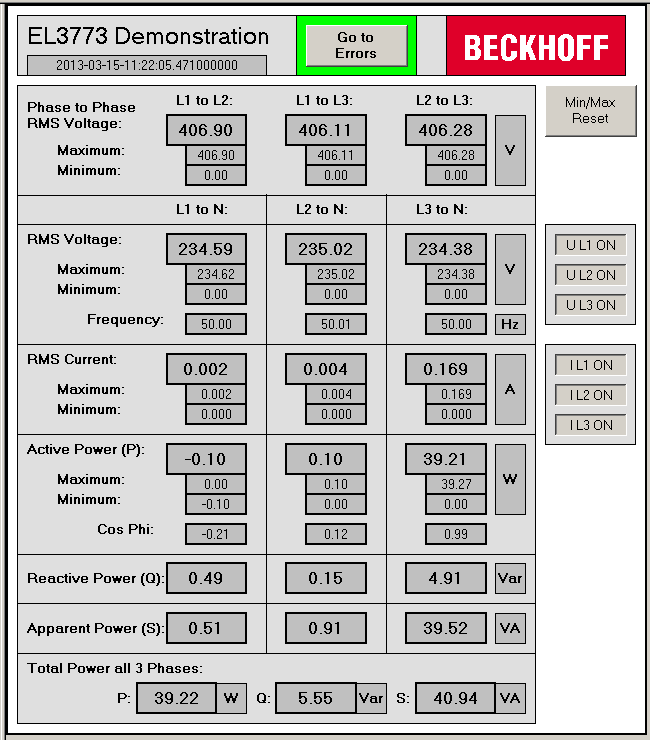 Fig.141: First page of the visualization of the example program
The visualization consists of two pages. On the main page (see fig. First page of the visualization of the example program) all calculated values are displayed and the calculations for the channels can be switched on and off individually. Actuating the button labelled with "Go to Errors" opens the second page of the visualization, on which the errors that have occurred are displayed. Note that you can already see on the first page whether an error has occurred, because in this case there is a border around the aforementioned button (see fig. Border around the "Go to Errors" button if errors have occurred).
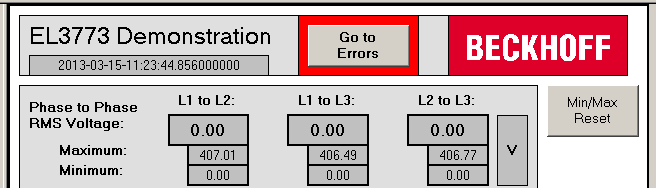 Fig.145: Border around the "Go to Errors" button if errors have occurred
Errors that have occurred are displayed on the second page of the visualization (see fig. Second page of the visualization of the EL3773 example program). In this case, for example, the EtherCAT cable from the controller to the coupler was removed during operation.
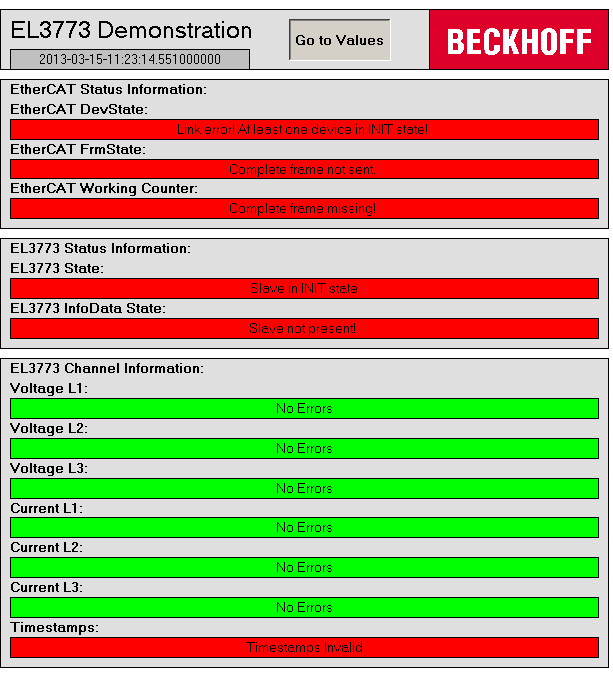 Fig.146: Second page of the visualization of the EL3773 example program
Selection of the size of the FIFO buffer
The recorded samples are copied per cycle into a FIFO buffer in which the newest values are saved "at the front" and the oldest values are discarded "at the rear". The size of the FIFO buffer can be specified at the beginning and should be selected according to the oversampling factor, the cycle time and the connected frequency. Important for an accurate evaluation of the connected voltages and currents is a sufficiently large memory of recorded values. If the connected frequency is, for example, 50 Hz, then 4 values will be recorded per PLC cycle with an oversampling factor of 20 and a cycle time of 5 ms. The period at a frequency of 50 Hz is 20 ms and with the selected settings an entire period is sampled with 80 values. Hence, the size of the FIFO buffer should be an integral multiple of 80, for example 800.
The following illustration provides an overview of the principle of operation of the data buffer:
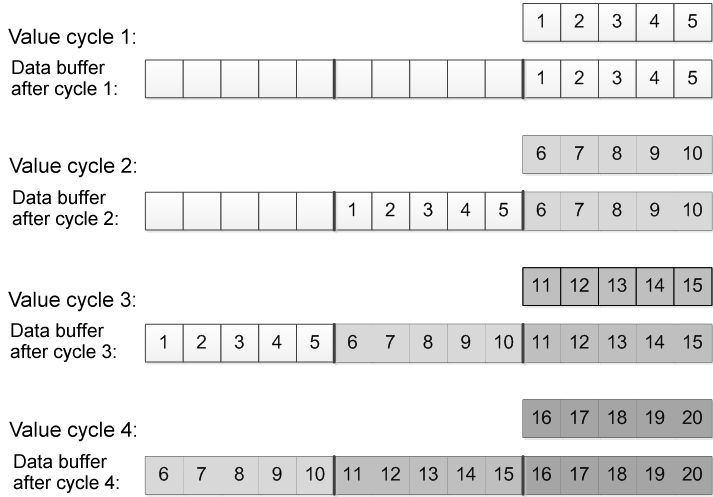 Fig.147: Principle of operation of the data buffer
Performance of the calculations
Unless stated otherwise, all calculations are performed as sliding calculations with all of the calculated values in the FIFO buffer. Beyond that it has proven better in practice to form an average from the last calculated values. The number of values for this can be specified by the user with the global variable CnMaxRecordedValues.
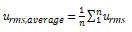
Example: The general equation for the calculation of the RMS value is

The respective lower and upper limits for the summation are specified by the size of the FIFO buffer. The RMS values are calculated by means of a sliding calculation of the entire size of the FIFO buffer in each cycle.
The result of the calculation is written in turn to a FIFO buffer, which is used to calculate the value displayed in the visualization by means of a sliding calculation:
The range for the summation is specified by the user via the global variable CnMaxRecordedValues.
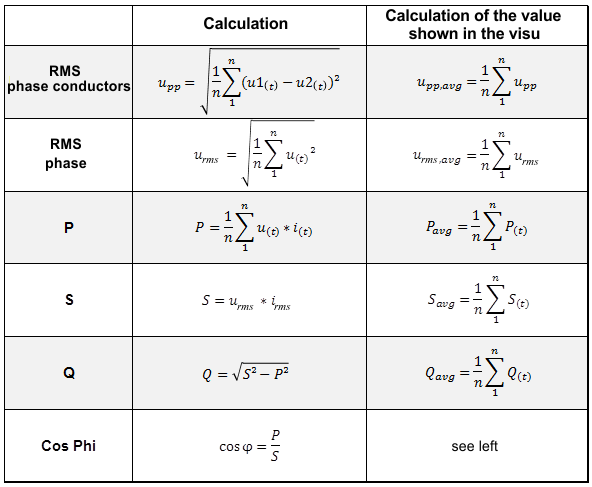 Fig.142: Overview of the performance of the calculations
 | Calculation of the frequency and the sign of the reactive power Q The frequency is calculated by determining the zero point of the zero crossing from positive to negative. This time is constantly determined and compared with the previous zero crossing. |