Thermocouples measurement
In the measuring range of a specified thermocouple type, a measured voltage is converted internally into a temperature according to the set transformation. Since the channel measures a voltage internally, the corresponding measuring error in the voltage measuring range must be used.
The following tables with the specification of the thermocouple measurement apply only when using the internal cold junction.
The EL331x-00xx can also be used with an external cold junction if required. The uncertainties must then be determined for the external cold junction on the application side. The temperature value of the external cold junction must then be communicated to the EL331x-00xx via the process data for its own calculation. The effect on the measurement of the thermocouples must then be calculated on the system side.
The specifications for the internal cold junction and the measuring range given here apply only if the following times are adhered to for thermal stabilization at constant ambient temperature:
- after switching on: 60 min
- after changing wiring/connectors: 15 min
Specification of the internal cold junction measurement
In the EL3312 each channel has its own cold junction sensor.
Measurement mode | Cold junction | |
|---|---|---|
Basic accuracy: Measurement deviation at 23°C, with averaging | < ±2.0°C | |
Temperature coefficient | Tk | < 40 mK/K |
Specification: Thermocouple type B
Temperature measurement thermocouple | Type B | |
|---|---|---|
Electrical measuring range used | ± 75 mV | |
Measuring range, technically available | +600 °C ≈ 1.792 mV … +1800 °C ≈ 13.591 mV | |
Measuring range, end value (full scale value) | +1800 °C | |
Measuring range, recommended | +750 °C … +1800 °C | |
PDO LSB | 0.1/0.01 °C/digit, depending on PDO setting Note: internally, 16 bits are used for the calculation up to the FSV; depending on the set thermocouple, therefore, jumps in value >0.01 °C occur with "resolution 0.01 °C"; e.g. type B: approx. 0.05 °C. | |
Uncertainty in the recommended measuring range*) | @ 23 °C ambient temperature | ± 8.5 K ≈ ± 0.47 %FSV |
@ 55 °C ambient temperature | ± 9.7 K ≈ ± 0.54 %FSV | |
Temperature coefficient | Since the value is highly dependent on the sensor temperature, as can be seen in the specification plot shown below, it must basically be derived from the specification plot. For better approximation, the measurement uncertainty at Tamb= 39 °C as the middle point between 23 °C and 55 °C is also shown informatively in order to illustrate the non-linear curve. | |
*) with averaging, incl. int. CJ uncertainty (added quadratically in the voltage dimension)
Measurement uncertainty for thermocouple type B:
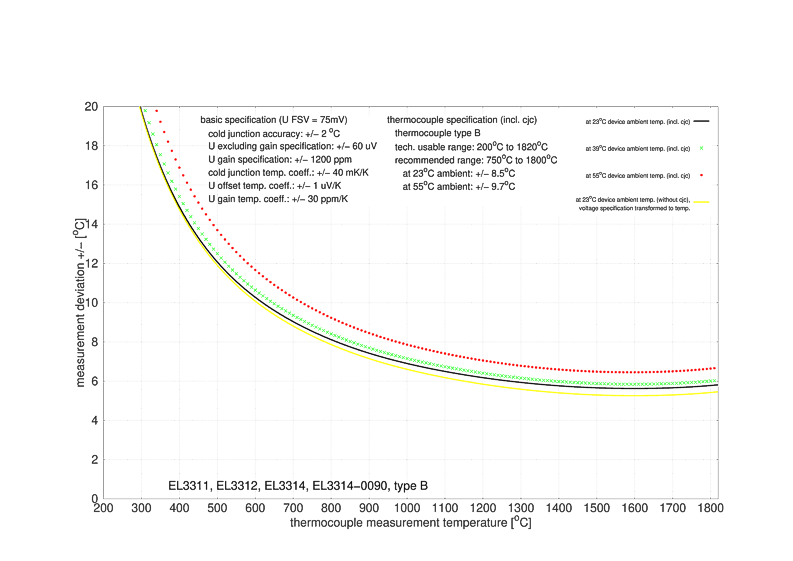 Fig.18: EL3311, EL3312, EL3314, EL3314-0090, type B
Notice | |
Voltage specification transferred to Temp. This characteristic curve is calculated with the respective voltage-dependent gain/offset uncertainties and may therefore provide significantly smaller values than the formal recalculation with the specifications of the electrical measuring range used. |
Specification - thermocouple type C
Temperature measurement thermocouple | Type C | |
|---|---|---|
Electrical measuring range used | ± 75 mV | |
Measuring range, technically available | 0 °C ≈ 0 mV … +2320 °C ≈ 37.107 mV | |
Measuring range, end value (full scale value) | +2320 °C | |
Measuring range, recommended | 0 °C … +2000 °C | |
PDO LSB | 0.1/0.01 °C/digit, depending on PDO setting Note: internally, 16 bits are used for the calculation up to the FSV; depending on the set thermocouple, therefore, jumps in value >0.01 °C occur with "resolution 0.01 °C"; e.g. type C: approx. 0.07 °C. | |
Uncertainty in the recommended measuring range*) | @ 23 °C ambient temperature | ± 6.2 K ≈ ± 0.27 %FSV |
@ 55 °C ambient temperature | ± 7.4 K ≈ ± 0.32 %FSV | |
Temperature coefficient | Since the value is highly dependent on the sensor temperature, as can be seen in the specification plot shown below, it must basically be derived from the specification plot. For better approximation, the measurement uncertainty at Tamb= 39 °C as the middle point between 23 °C and 55 °C is also shown informatively in order to illustrate the non-linear curve. | |
*) with averaging, incl. int. CJ uncertainty (added quadratically in the voltage dimension)
Measurement uncertainty for thermocouple type C:
 Fig.19: EL3311, EL3312, EL3314, EL3314-0090, type C
Notice | |
Voltage specification transferred to Temp. This characteristic curve is calculated with the respective voltage-dependent gain/offset uncertainties and may therefore provide significantly smaller values than the formal recalculation with the specifications of the electrical measuring range used. |
Specification - thermocouple type E
Temperature measurement thermocouple | Type E | |
|---|---|---|
Electrical measuring range used | ± 75 mV | |
Measuring range, technically available | -100 °C ≈ -5.237 mV … +1000 °C ≈ 76.372 mV | |
Measuring range, end value (full scale value) | +1000 °C | |
Measuring range, recommended | -100 °C … +1000 °C | |
PDO LSB | 0.1/0.01 °C/digit, depending on PDO setting Note: internally, 16 bits are used for the calculation up to the FSV; depending on the set thermocouple, therefore, jumps in value >0.01 °C occur with "resolution 0.01 °C"; e.g. type E: approx. 0.03 °C. | |
Uncertainty in the recommended measuring range*) | @ 23 °C ambient temperature | ± 2.5 K ≈ ± 0.25 %FSV |
@ 55 °C ambient temperature | ± 3.0 K ≈ ± 0.30 %FSV | |
Temperature coefficient | Since the value is highly dependent on the sensor temperature, as can be seen in the specification plot shown below, it must basically be derived from the specification plot. For better approximation, the measurement uncertainty at Tamb= 39 °C as the middle point between 23 °C and 55 °C is also shown informatively in order to illustrate the non-linear curve. | |
*) with averaging, incl. int. CJ uncertainty (added quadratically in the voltage dimension)
Measurement uncertainty for thermocouple type E:
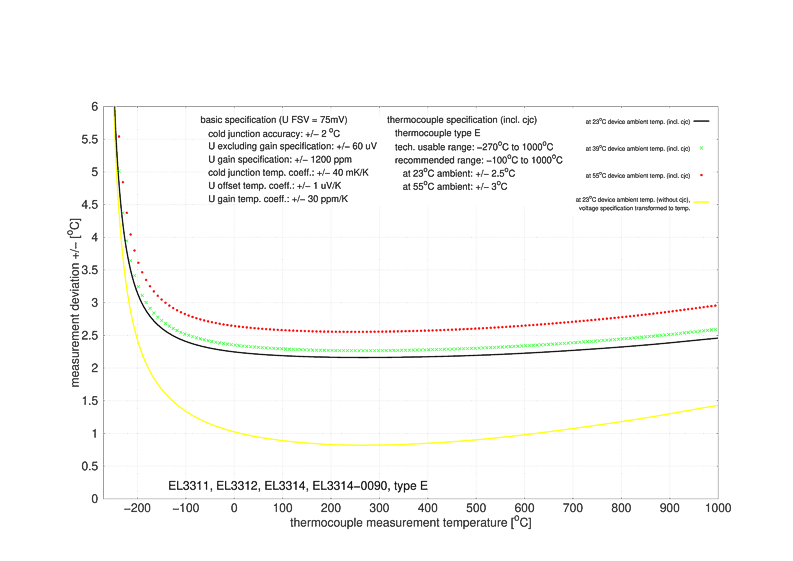 Fig.20: EL3311, EL3312, EL3314, EL3314-0090, type E
Notice | |
Voltage specification transferred to Temp. This characteristic curve is calculated with the respective voltage-dependent gain/offset uncertainties and may therefore provide significantly smaller values than the formal recalculation with the specifications of the electrical measuring range used. |
Specification - thermocouple type J
Temperature measurement thermocouple | Type J | |
|---|---|---|
Electrical measuring range used | ± 75 mV | |
Measuring range, technically available | -100 °C ≈ -4.632 mV … +1200 °C ≈ 69.553 mV | |
Measuring range, end value (full scale value) | +1200 °C | |
Measuring range, recommended | -100 °C … +1200 °C | |
PDO LSB | 0.1/0.01 °C/digit, depending on PDO setting Note: internally, 16 bits are used for the calculation up to the FSV; depending on the set thermocouple, therefore, jumps in value >0.01 °C occur with "resolution 0.01 °C"; e.g. type J: approx. 0.04 °C. | |
Uncertainty in the recommended measuring range*) | @ 23 °C ambient temperature | ± 2.7 K ≈ ± 0.23 %FSV |
@ 55 °C ambient temperature | ± 3.2 K ≈ ± 0.27 %FSV | |
Temperature coefficient | Since the value is highly dependent on the sensor temperature, as can be seen in the specification plot shown below, it must basically be derived from the specification plot. For better approximation, the measurement uncertainty at Tamb= 39 °C as the middle point between 23 °C and 55 °C is also shown informatively in order to illustrate the non-linear curve. | |
*) with averaging, incl. int. CJ uncertainty (added quadratically in the voltage dimension)
Measurement uncertainty for thermocouple type J:
 Fig.21: EL3311, EL3312, EL3314, EL3314-0090, type J
Notice | |
Voltage specification transferred to Temp. This characteristic curve is calculated with the respective voltage-dependent gain/offset uncertainties and may therefore provide significantly smaller values than the formal recalculation with the specifications of the electrical measuring range used. |
Specification - thermocouple type K
Temperature measurement thermocouple | Type K | |
|---|---|---|
Electrical measuring range used | ± 75 mV | |
Measuring range, technically available | -200 °C ≈ -5.891 mV … +1370 °C ≈ 54.818 mV | |
Measuring range, end value (full scale value) | +1370 °C | |
Measuring range, recommended | -100 °C … +1200 °C | |
PDO LSB | 0.1/0.01 °C/digit, depending on PDO setting Note: internally, 16 bits are used for the calculation up to the FSV; depending on the set thermocouple, therefore, jumps in value >0.01 °C occur with "resolution 0.01 °C"; e.g. type K: approx. 0.04 °C. | |
Uncertainty in the recommended measuring range*) | @ 23 °C ambient temperature | ± 3.0 K ≈ ± 0.22 %FSV |
@ 55 °C ambient temperature | ± 3.6 K ≈ ± 0.26 %FSV | |
Temperature coefficient | Since the value is highly dependent on the sensor temperature, as can be seen in the specification plot shown below, it must basically be derived from the specification plot. For better approximation, the measurement uncertainty at Tamb= 39 °C as the middle point between 23 °C and 55 °C is also shown informatively in order to illustrate the non-linear curve. | |
*) with averaging, incl. int. CJ uncertainty (added quadratically in the voltage dimension)
Measurement uncertainty for thermocouple type K:
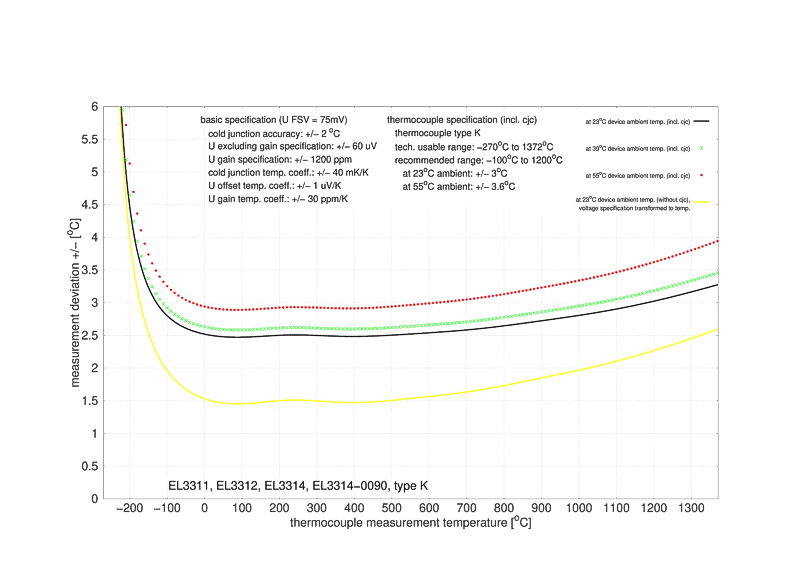 Fig.22: EL3311, EL3312, EL3314, EL3314-0090, type K
Notice | |
Voltage specification transferred to Temp. This characteristic curve is calculated with the respective voltage-dependent gain/offset uncertainties and may therefore provide significantly smaller values than the formal recalculation with the specifications of the electrical measuring range used. |
Specification - thermocouple type L
Temperature measurement thermocouple | Type L | |
|---|---|---|
Electrical measuring range used | ± 75 mV | |
Measuring range, technically available | 0 °C ≈ 0 mV … +900 °C ≈ 52.430 mV | |
Measuring range, end value (full scale value) | +900 °C | |
Measuring range, recommended | 0 °C … +900 °C | |
PDO LSB | 0.1/0.01 °C/digit, depending on PDO setting Note: internally, 16 bits are used for the calculation up to the FSV; depending on the set thermocouple, therefore, jumps in value >0.01 °C occur with "resolution 0.01 °C"; e.g. type L: approx. 0.03 °C. | |
Uncertainty in the recommended measuring range*) | @ 23 °C ambient temperature | ± 2.3 K ≈ ± 0.26 %FSV |
@ 55 °C ambient temperature | ± 2.8 K ≈ ± 0.31 %FSV | |
Temperature coefficient | Since the value is highly dependent on the sensor temperature, as can be seen in the specification plot shown below, it must basically be derived from the specification plot. For better approximation, the measurement uncertainty at Tamb= 39 °C as the middle point between 23 °C and 55 °C is also shown informatively in order to illustrate the non-linear curve. | |
*) with averaging, incl. int. CJ uncertainty (added quadratically in the voltage dimension)
Measurement uncertainty for thermocouple type L:
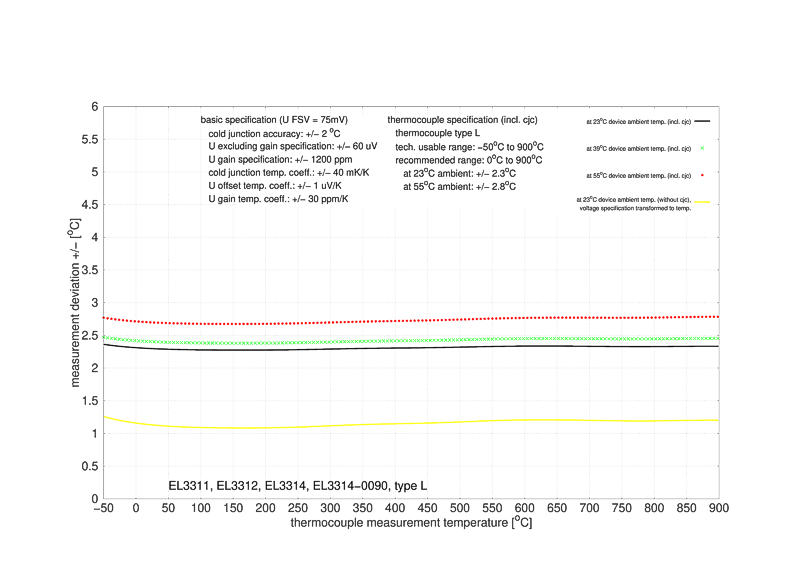 Fig.23: EL3311, EL3312, EL3314, EL3314-0090, type L
Notice | |
Voltage specification transferred to Temp. This characteristic curve is calculated with the respective voltage-dependent gain/offset uncertainties and may therefore provide significantly smaller values than the formal recalculation with the specifications of the electrical measuring range used. |
Specification - thermocouple type N
Temperature measurement thermocouple | Type N | |
|---|---|---|
Electrical measuring range used | ± 75 mV | |
Measuring range, technically available | -100 °C ≈ -2.406 mV … +1300 °C ≈ 47.513 mV | |
Measuring range, end value (full scale value) | +1300 °C | |
Measuring range, recommended | 0 °C … +1300 °C | |
PDO LSB | 0.1/0.01 °C/digit, depending on PDO setting Note: internally, 16 bits are used for the calculation up to the FSV; depending on the set thermocouple, therefore, jumps in value >0.01 °C occur with "resolution 0.01 °C"; e.g. type N: approx. 0.04 °C. | |
Uncertainty in the recommended measuring range*) | @ 23 °C ambient temperature | ± 3.0 K ≈ ± 0.23 %FSV |
@ 55 °C ambient temperature | ± 3.5 K ≈ ± 0.27 %FSV | |
Temperature coefficient | Since the value is highly dependent on the sensor temperature, as can be seen in the specification plot shown below, it must basically be derived from the specification plot. For better approximation, the measurement uncertainty at Tamb= 39 °C as the middle point between 23 °C and 55 °C is also shown informatively in order to illustrate the non-linear curve. | |
*) with averaging, incl. int. CJ uncertainty (added quadratically in the voltage dimension)
Measurement uncertainty for thermocouple type N:
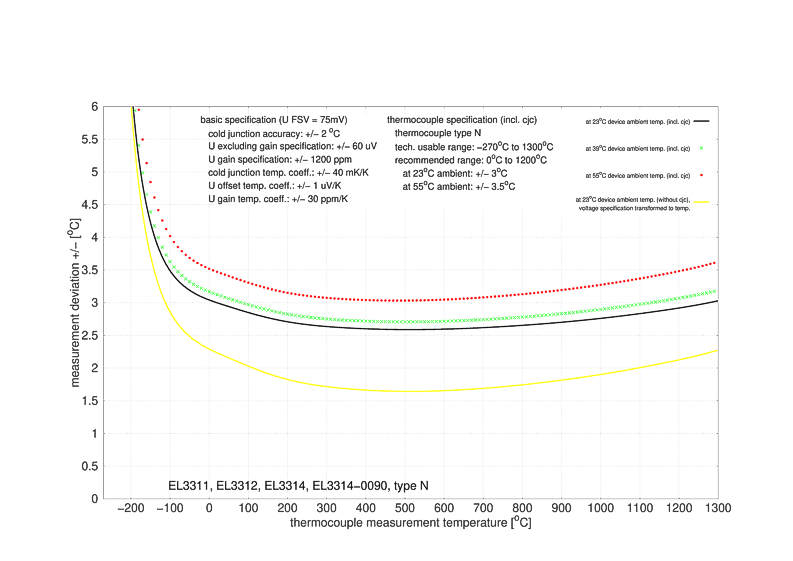 Fig.24: EL3311, EL3312, EL3314, EL3314-0090, type N
Notice | |
Voltage specification transferred to Temp. This characteristic curve is calculated with the respective voltage-dependent gain/offset uncertainties and may therefore provide significantly smaller values than the formal recalculation with the specifications of the electrical measuring range used. |
Specification - thermocouple type R
Temperature measurement thermocouple | Type R | |
|---|---|---|
Electrical measuring range used | ± 75 mV | |
Measuring range, technically available | 0 °C ≈ 0 mV … +1767 °C ≈ 21.089 mV | |
Measuring range, end value (full scale value) | +1767 °C | |
Measuring range, recommended | +250 °C … +1700 °C | |
PDO LSB | 0.1/0.01 °C/digit, depending on PDO setting Note: internally, 16 bits are used for the calculation up to the FSV; depending on the set thermocouple, therefore, jumps in value >0.01 °C occur with "resolution 0.01 °C"; e.g. type R: approx. 0.05 °C. | |
Uncertainty in the recommended measuring range*) | @ 23 °C ambient temperature | ± 6.7 K ≈ ± 0.38 %FSV |
@ 55 °C ambient temperature | ± 7.7 K ≈ ± 0.44 %FSV | |
Temperature coefficient | Since the value is highly dependent on the sensor temperature, as can be seen in the specification plot shown below, it must basically be derived from the specification plot. For better approximation, the measurement uncertainty at Tamb= 39 °C as the middle point between 23 °C and 55 °C is also shown informatively in order to illustrate the non-linear curve. | |
*) with averaging, incl. int. CJ uncertainty (added quadratically in the voltage dimension)
Measurement uncertainty for thermocouple type R:
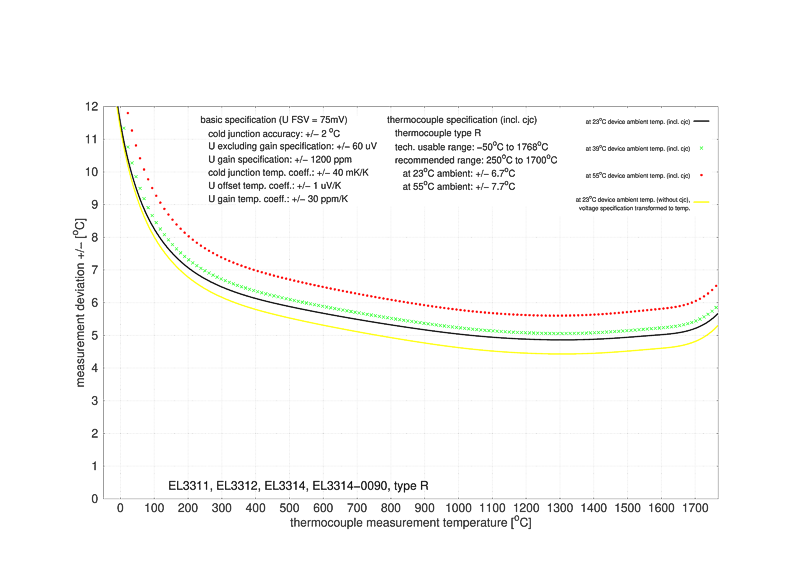 Fig.25: EL3311, EL3312, EL3314, EL3314-0090, type R
Notice | |
Voltage specification transferred to Temp. This characteristic curve is calculated with the respective voltage-dependent gain/offset uncertainties and may therefore provide significantly smaller values than the formal recalculation with the specifications of the electrical measuring range used. |
Specification - thermocouple type S
Temperature measurement thermocouple | Type S | |
|---|---|---|
Electrical measuring range used | ± 75 mV | |
Measuring range, technically available | 0 °C ≈ 0 mV … +1760 °C ≈ 17.947 mV | |
Measuring range, end value (full scale value) | +1760 °C | |
Measuring range, recommended | +250 °C … +1700 °C | |
PDO LSB | 0.1/0.01 °C/digit, depending on PDO setting Note: internally, 16 bits are used for the calculation up to the FSV; depending on the set thermocouple, therefore, jumps in value >0.01 °C occur with "resolution 0.01 °C"; e.g. type S: approx. 0.05 °C. | |
Uncertainty in the recommended measuring range*) | @ 23 °C ambient temperature | ± 7.1 K ≈ ± 0.40 %FSV |
@ 55 °C ambient temperature | ± 8.1 K ≈ ± 0.46 %FSV | |
Temperature coefficient | Since the value is highly dependent on the sensor temperature, as can be seen in the specification plot shown below, it must basically be derived from the specification plot. For better approximation, the measurement uncertainty at Tamb= 39 °C as the middle point between 23 °C and 55 °C is also shown informatively in order to illustrate the non-linear curve. | |
*) with averaging, incl. int. CJ uncertainty (added quadratically in the voltage dimension)
Measurement uncertainty for thermocouple type S:
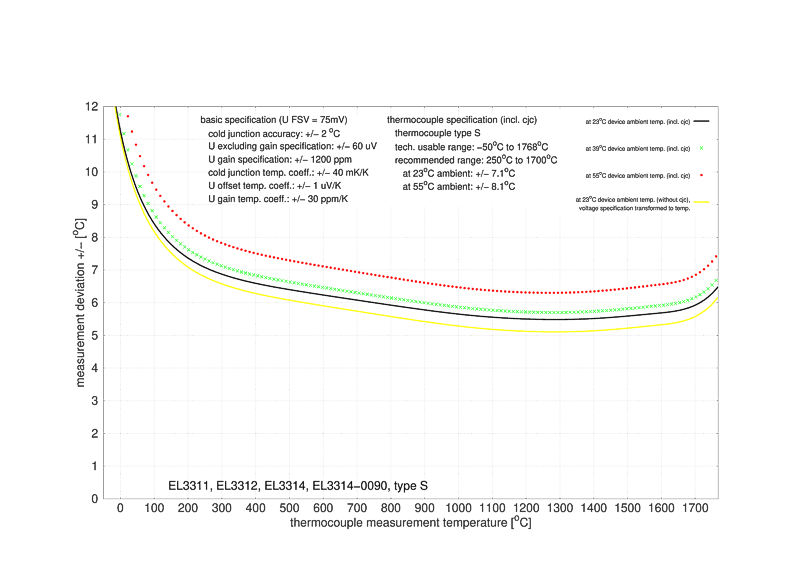 Fig.26: EL3311, EL3312, EL3314, EL3314-0090, type S
Notice | |
Voltage specification transferred to Temp. This characteristic curve is calculated with the respective voltage-dependent gain/offset uncertainties and may therefore provide significantly smaller values than the formal recalculation with the specifications of the electrical measuring range used. |
Specification - thermocouple type T
Temperature measurement thermocouple | Type T | |
|---|---|---|
Electrical measuring range used | ± 75 mV | |
Measuring range, technically available | -200 °C ≈ -5.603 mV … +400 °C ≈ 20.872 mV | |
Measuring range, end value (full scale value) | +400 °C | |
Measuring range, recommended | -100 °C … +400 °C | |
PDO LSB | 0.1/0.01 °C/digit, depending on PDO setting | |
Uncertainty in the recommended measuring range*) | @ 23 °C ambient temperature | ± 2.9 K ≈ ± 0.73 %FSV |
@ 55 °C ambient temperature | ± 3.4 K ≈ ± 0.85 %FSV | |
Temperature coefficient | Since the value is highly dependent on the sensor temperature, as can be seen in the specification plot shown below, it must basically be derived from the specification plot. For better approximation, the measurement uncertainty at Tamb= 39 °C as the middle point between 23 °C and 55 °C is also shown informatively in order to illustrate the non-linear curve. | |
*) with averaging, incl. int. CJ uncertainty (added quadratically in the voltage dimension)
Measurement uncertainty for thermocouple type T:
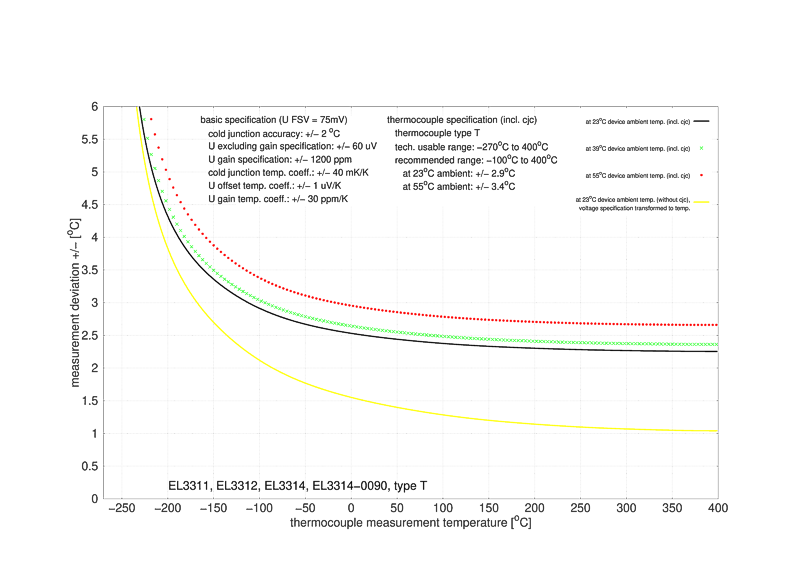 Fig.27: EL3311, EL3312, EL3314, EL3314-0090, type T
Notice | |
Voltage specification transferred to Temp. This characteristic curve is calculated with the respective voltage-dependent gain/offset uncertainties and may therefore provide significantly smaller values than the formal recalculation with the specifications of the electrical measuring range used. |
Specification - thermocouple type U
Temperature measurement thermocouple | Type U | |
|---|---|---|
Electrical measuring range used | ± 75 mV | |
Measuring range, technically available | 0 °C ≈ 0 mV … +600 °C ≈ 33.600 mV | |
Measuring range, end value (full scale value) | +600 °C | |
Measuring range, recommended | 0 °C … +600 °C | |
PDO LSB | 0.1/0.01 °C/digit, depending on PDO setting Note: internally, 16 bits are used for the calculation up to the FSV; depending on the set thermocouple, therefore, jumps in value >0.01 °C occur with "resolution 0.01 °C"; e.g. type U: approx. 0.02 °C. | |
Uncertainty in the recommended measuring range*) | @ 23 °C ambient temperature | ± 2.5 K ≈ ± 0.42 %FSV |
@ 55 °C ambient temperature | ± 2.9 K ≈ ± 0.48 %FSV | |
Temperature coefficient | Since the value is highly dependent on the sensor temperature, as can be seen in the specification plot shown below, it must basically be derived from the specification plot. For better approximation, the measurement uncertainty at Tamb= 39 °C as the middle point between 23 °C and 55 °C is also shown informatively in order to illustrate the non-linear curve. | |
*) with averaging, incl. int. CJ uncertainty (added quadratically in the voltage dimension)
Measurement uncertainty for thermocouple type U:
 Fig.28: EL3311, EL3312, EL3314, EL3314-0090, type U
Notice | |
Voltage specification transferred to Temp. This characteristic curve is calculated with the respective voltage-dependent gain/offset uncertainties and may therefore provide significantly smaller values than the formal recalculation with the specifications of the electrical measuring range used. |