Slave-Diagnose
DP-State
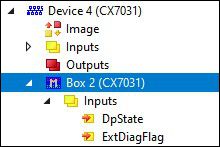
Each DP slave has a status variable that indicates the current state of that DP slave. This status is a real-time status, i.e. it always matches the current data of the DP slave and can be linked to a PLC variable (-> DpState of the slave):

Diagnostic data
Each DP slave can report DP diagnostic data acyclically during Data_Exchange operation. The slave sets the Diag_Flag in the response of the cyclic Data_Exchange telegram, whereupon the DP master automatically reads the DP diagnostic data from the slave. The data exchange cycle of the Beckhoff DP master is not affected, as the DP diagnostic telegram is sent at the end of the cyclic data exchange cycle (before the start of the next cycle). If the DP diagnostic data read from the slave has changed compared to the last status, the DP master sets the ExtDiagFlag variable, which can be linked to a variable in the control program.
The current diagnostic data of the DP slave is displayed in the System Manager tab Diag of the slave. It can also be read by the control program via ADS, which will cause the "ExtDiagFlag" flag to be reset once more:
ADS-Read parameters | Meaning |
|---|---|
Net-ID | Net-ID of the master (see the device's ADS tab) |
Port | 200 |
IndexGroup | 0x00yyF181 (yy = address of the slave) |
IndexOffset | Offset within the diagnostic data |
Length | Length of the diagnostic data to be read |
Data | Diagnostic data |
The diagnostic data contains the slave statistics (32 bytes) and the DP diagnostic data sent by the slave (up to 244 bytes), and is constructed as follows:
Offset | Meaning |
|---|---|
Slave statistics | |
0 | Receive-Error-Counter (WORD): Number of faulty telegrams during communication with this slave |
2 | Repeat-Counter[8] (WORD): The repeat counters show how often and how many repeats had to be made. Repeat-Counter[0] shows how often a telegram to this slave had to be repeated once, Repeat-Counter[1] how often a telegram to this slave had to be repeated twice, etc. The maximum number of repetitions is set with the parameter Max Retry-Limit (see dialog Bus-Parameter), the value range is from 0 to 8, so there are 8 Repeat-Counters here (for 1 to 8 repetitions) |
18 | reserved for extensions |
20 | NoAnswer-Counter (DWORD): Number of telegrams during communication with this slave that were not answered. If a slave does not respond the first time, the telegram is repeated according to the MaxRetryLimit; if it still does not respond, it is not repeated the next time. |
24-27 | Last-DPV1-Error[4] (BYTE): The last faulty DPV1 response is entered here (byte 0: DPV1 service (bit 7 is set and thus indicates an error), byte 1: Error_Decode, byte 2: Error_Code_1 (Error_Class/Error_Code), byte 3: Error_Code_2), see description DPV1 error codes |
27-31 | reserved for extensions |
from 32 | DP diagnostic data |
There follows a description of the DP diagnostic data
Offset | Meaning |
|---|---|
0x00.0 | StationNonExistent: Slave did not respond to the last telegram |
0x00.1 | StationNotReady: Slave is still processing the Set_Prm or Chk_Cfg telegram |
0x00.2 | CfgFault: Slave reports a configuration error |
0x00.3 | ExtDiag: Extended DiagData are available and valid |
0x00.4 | NotSupported: Slave does not support a feature that was requested with Set_Prm or Global_Control |
0x00.5 | InvalidSlaveResponse: Slave does not respond in accordance with DP |
0x00.6 | PrmFault: Slave reports a parameterization error |
0x00.7 | MasterLock: Slave is exchanging data with another master |
0x01.0 | PrmReq: Slave must be re-parameterized and reconfigured |
0x01.1 | StatDiag: Slave reports static diagnosis or application of DPV1 slave not yet ready for data exchange |
0x01.2 | PROFIBUS DP slave |
0x01.3 | WdOn: DP watchdog is switched on |
0x01.4 | FreezeMode: DP slave is in freeze mode |
0x01.5 | SyncMode: DP slave is in Sync mode |
0x01.6 | reserved |
0x01.7 | Deactivated: DP slave has been deactivated |
0x02.0 | reserved |
0x02.1 | reserved |
0x02.2 | reserved |
0x02.3 | reserved |
0x02.4 | reserved |
0x02.5 | reserved |
0x02.6 | reserved |
0x02.7 | ExtDiagOverflow: too much Extended DiagData available |
0x03 | MasterAdd: Address of the master that exchanges data with the slave |
0x04,0x05 | IdentNumber |
from 0x06 | Extended DiagData |
Extended DiagData
The Extended DiagData distinguishes between identifier diagnostics, channel diagnostics and manufacturer-specific diagnostics, with the first byte indicating the type of diagnostics and the length of the associated data. Several diagnostic types can also follow one another in the Extended DiagData.
Header byte
Bit | Meaning |
|---|---|
0-5 | Length of the associated diagnostic data, including header byte |
6-7 | 0 = manufacturer-specific diagnostics (DPV1 is not supported) or DPV1 diagnostics (DPV1 is supported (DPV1_Enable = 1) in associated GSD file) |
Module diagnostics | |
Channel diagnostics | |
Revision Number |
Manufacturer-specific diagnostics
The structure of the manufacturer-specific diagnostics may be found in the documentation for the DP slave.