Sample Array Marker
Im Folgenden wird die Verwendung von Markern in einem ScopeProject unter der Nutzung eines Array-Bar-Charts erläutert.
In diesem Sample wird die Programmiersprache C# verwendet.
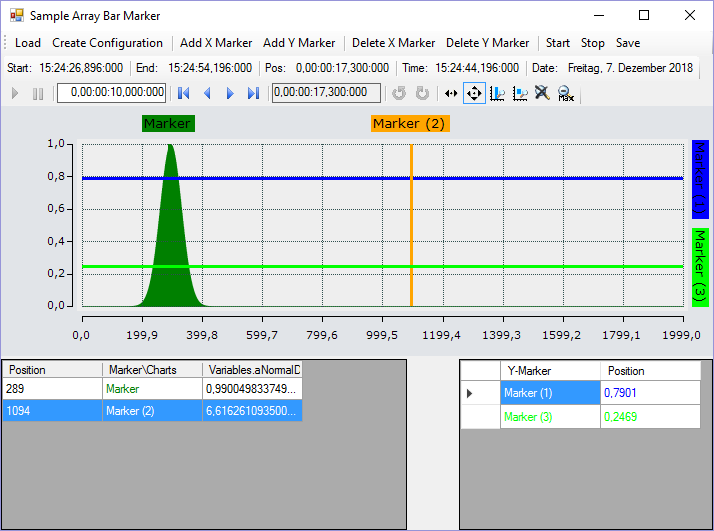
Zuerst wird eine Windows Forms Application erstellt. Mithilfe der Toolbox werden der Form eine Toolbar sowie die oben abgebildeten Buttons hinzugefügt. Anschließend wird ein ChartPanel eingefügt und die „Dock“-Property auf „Fill“ gesetzt, damit der Graph das Fenster vollständig ausfüllt. Außerdem sollen die Marker-Werte in Tabellen dargestellt werden. Hierzu müssen der Form zwei DataGridView-Elemente hinzugefügt werden. Bei dem rechten DataGridView müssen die beiden Spalten „Y-Marker“ und „Position“ hinzugefügt werden. Dazu wird im Properties-Window in der Zeile „Columns“ auf Browse geklickt, sodass sich der Dialog Edit Columns öffnet. Dort können dann über Add neue Spalten erstellt werden. Dabei entspricht der Header-Text der angezeigten Spaltenüberschrift.
Der Code hinter den Buttons Load und Create Configuration entspricht größtenteils dem Code aus dem Sample vom Array Bar Chart. Es muss lediglich eine zusätzliche Spalte für den Kanal im DataGridView angelegt werden.
private string filename = @"..\..\ScopeTestYTMarker.tcscopex";
ScopeProject scopeProject = new ScopeProject();
AxisGroup axisGroup
{
    get
    {
        if (scopeProject.SubMember.OfType<Chart>().Count() == 0) return null;
        return scopeProject.SubMember.OfType<Chart>().First().SubMember.OfType<AxisGroup>().First();
    }
}
private void btnLoad_Click(object sender, EventArgs e)
{
    FileInfo fInfo = new FileInfo(filename);
    if (!fInfo.Exists)
    {
        MessageBox.Show("File not found! Please use the Add Chart button to create a config! Once a config is created and saved it can be load using the Load button!", "File not found",
        MessageBoxButtons.OK, MessageBoxIcon.Exclamation);
    }
    else
    {
        //delete old configuration
        scopeProject.Dispose();

        //load new configuration
        scopeProject = ScopeProject.LoadScopeProject(filename);
    }
    chartPanel.ModelChart = scopeProject.SubMember.OfType<Chart>().First();
}
Bei Create Configuration handelt es sich um eine Kombination aus den bekannten Buttons Add Chart, Add Axis und Add Channel.
private void btnCreateConfiguration_Click(object sender, EventArgs e)
{
    //Add Chart
    ArrayBarChart chart = new ArrayBarChart();
    scopeProject.AddMember(chart);

    //Add Axis
    AxisGroup axisGroup = new AxisGroup();
    chart.AddMember(axisGroup);

    //Add Channel
    Channel channel = new Channel();
    axisGroup.AddMember(channel);
    SetAcquisitions(channel);
    AdsAcquisition acquisition = (AdsAcquisition)channel.SubMember.OfType<AcquisitionInterpreter>().First().Acquisition;
    dataGridView1.Columns.Add(acquisition.SymbolName, acquisition.SymbolName);

    chartPanel.ModelChart = chart;
}

private void SetAcquisitions(Channel channel)
{
    AdsAcquisition acq = new AdsAcquisition();
    acq.AmsNetId = AmsNetId.Local;
    acq.TargetPort = 851;
    acq.IsSymbolBased = true;
    acq.SymbolName = "Variables.aNormalDistribution";
    acq.DataType = DataTypeConverter.AdsToScope2Datatype(AdsDatatypeId.ADST_INT16);
    acq.SampleTime = (uint)(100 * TimeSpan.TicksPerMillisecond);
    acq.ArrayLength = 2000;
    acq.Oversample = 2000;
    AcquisitionInterpreter acquisitionInterpreter = new AcquisitionInterpreter();
    acquisitionInterpreter.Acquisition = acq;
    channel.AddMember(acquisitionInterpreter);
}
Das hier entwickelte Beispiel ist als VS-Projekt verfügbar: Projekt
Die Variablen beziehen sich auf das TwinCAT-Programm hinter folgender Datei: MeasurementSamplePLC.zip