Analyse data
- Open your TwinCAT Engineering environment to start the data analysis.
- 1. Open Visual Studio® > File > New > Project…
- 2. Select the Analytics project template from TwinCAT Measurement.
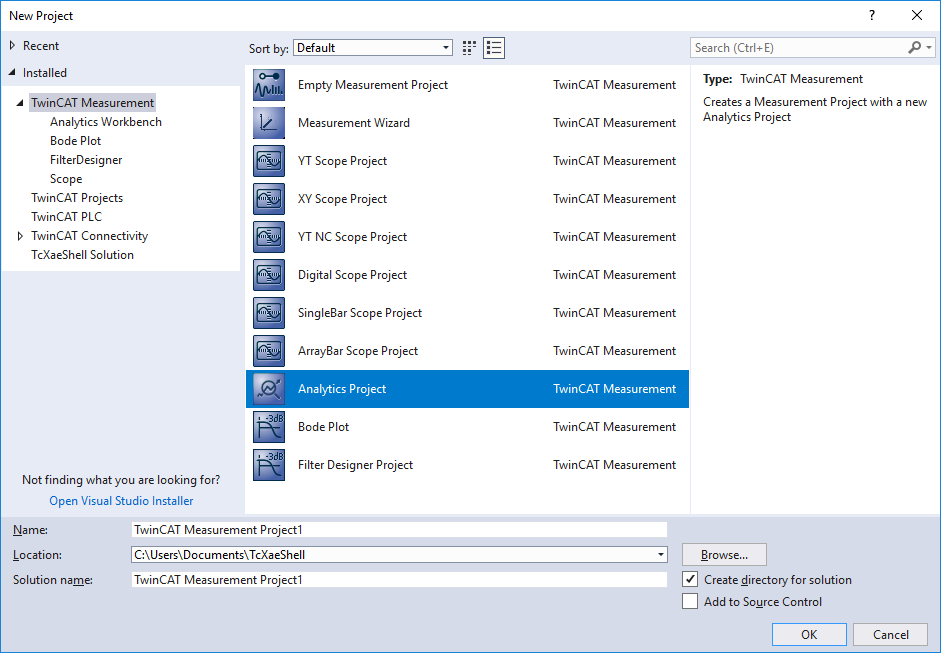
- The new project is displayed in the Solution Explorer. After clicking the Analytics Project tree node element a start window opens where you can select your first action. From here you can add a network, open the Toolbox, open the Target Browser or open the Analytics Storage Provider Recorder. In the following steps you will perform all these actions.
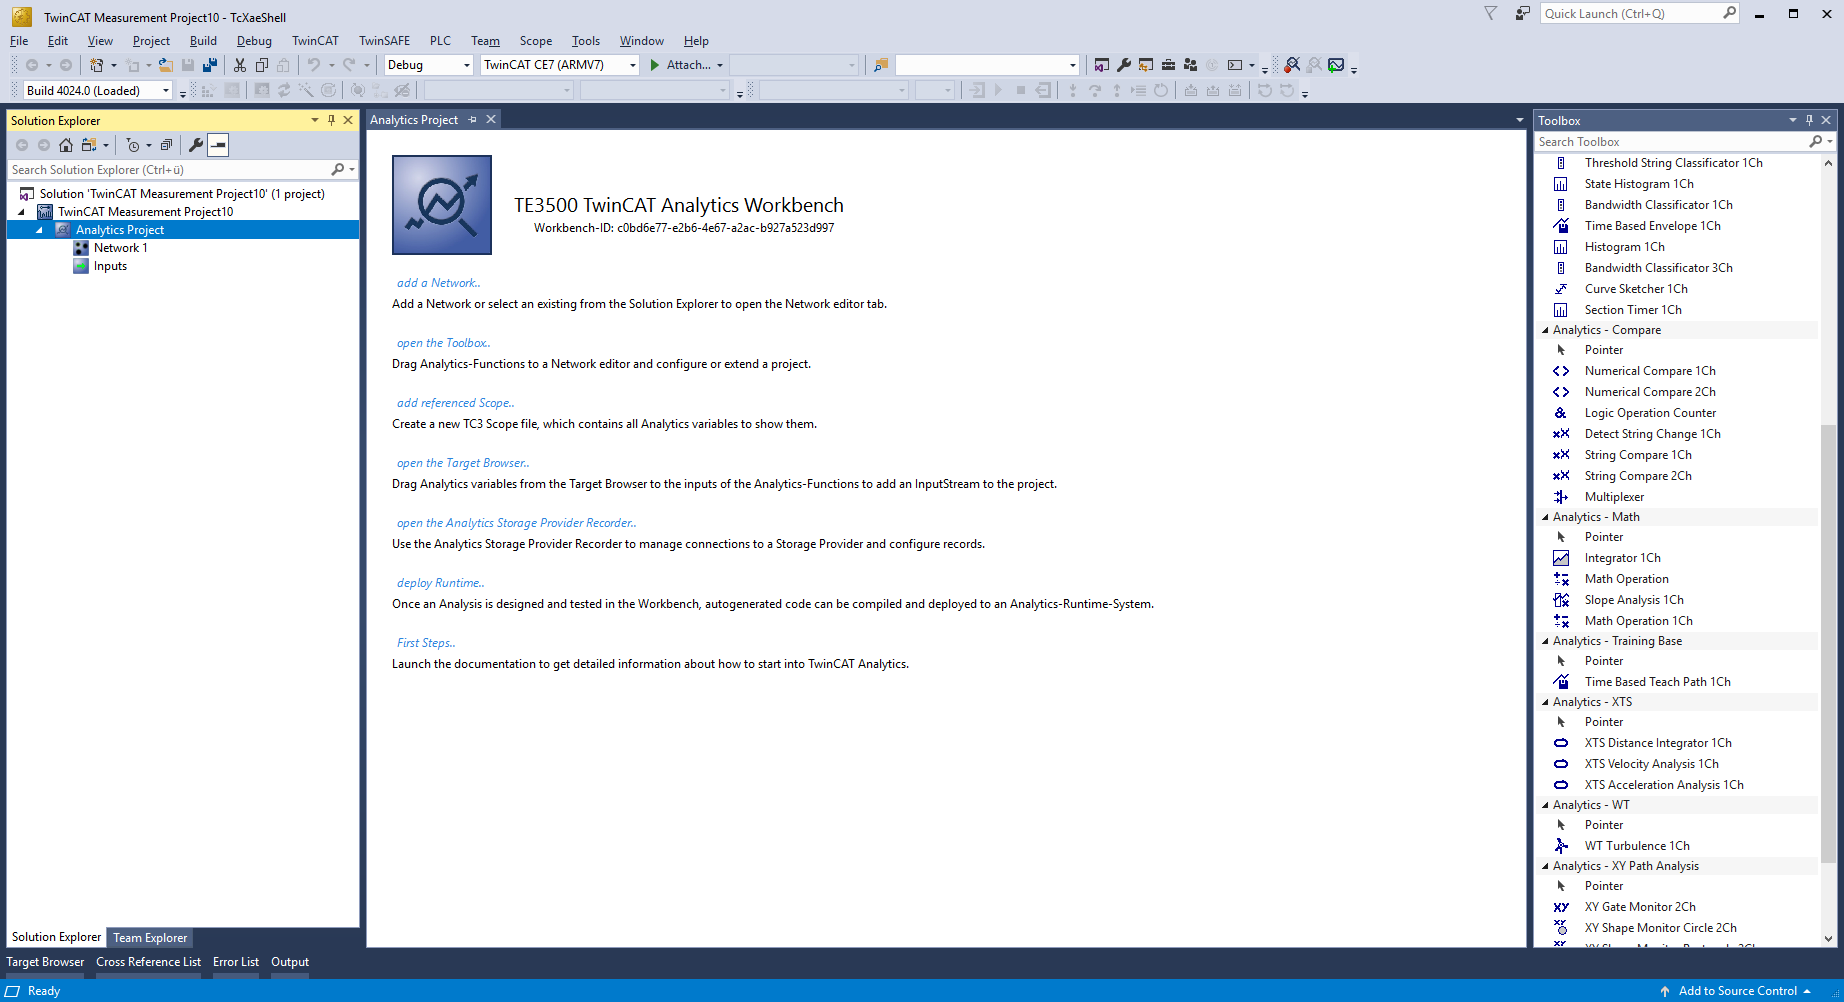
- 3. It makes sense to open the Toolbox of Visual Studio® first. There you will find all the algorithms supported by TwinCAT Analytics. Algorithms need to be grouped and organized into networks. Right-click Analytics Project to add a new network, or add a network using the start page. The first network is always generated by default.
- 4. When you click on the network, an editor opens. Now you can drag and drop the desired algorithm into the editor interface.
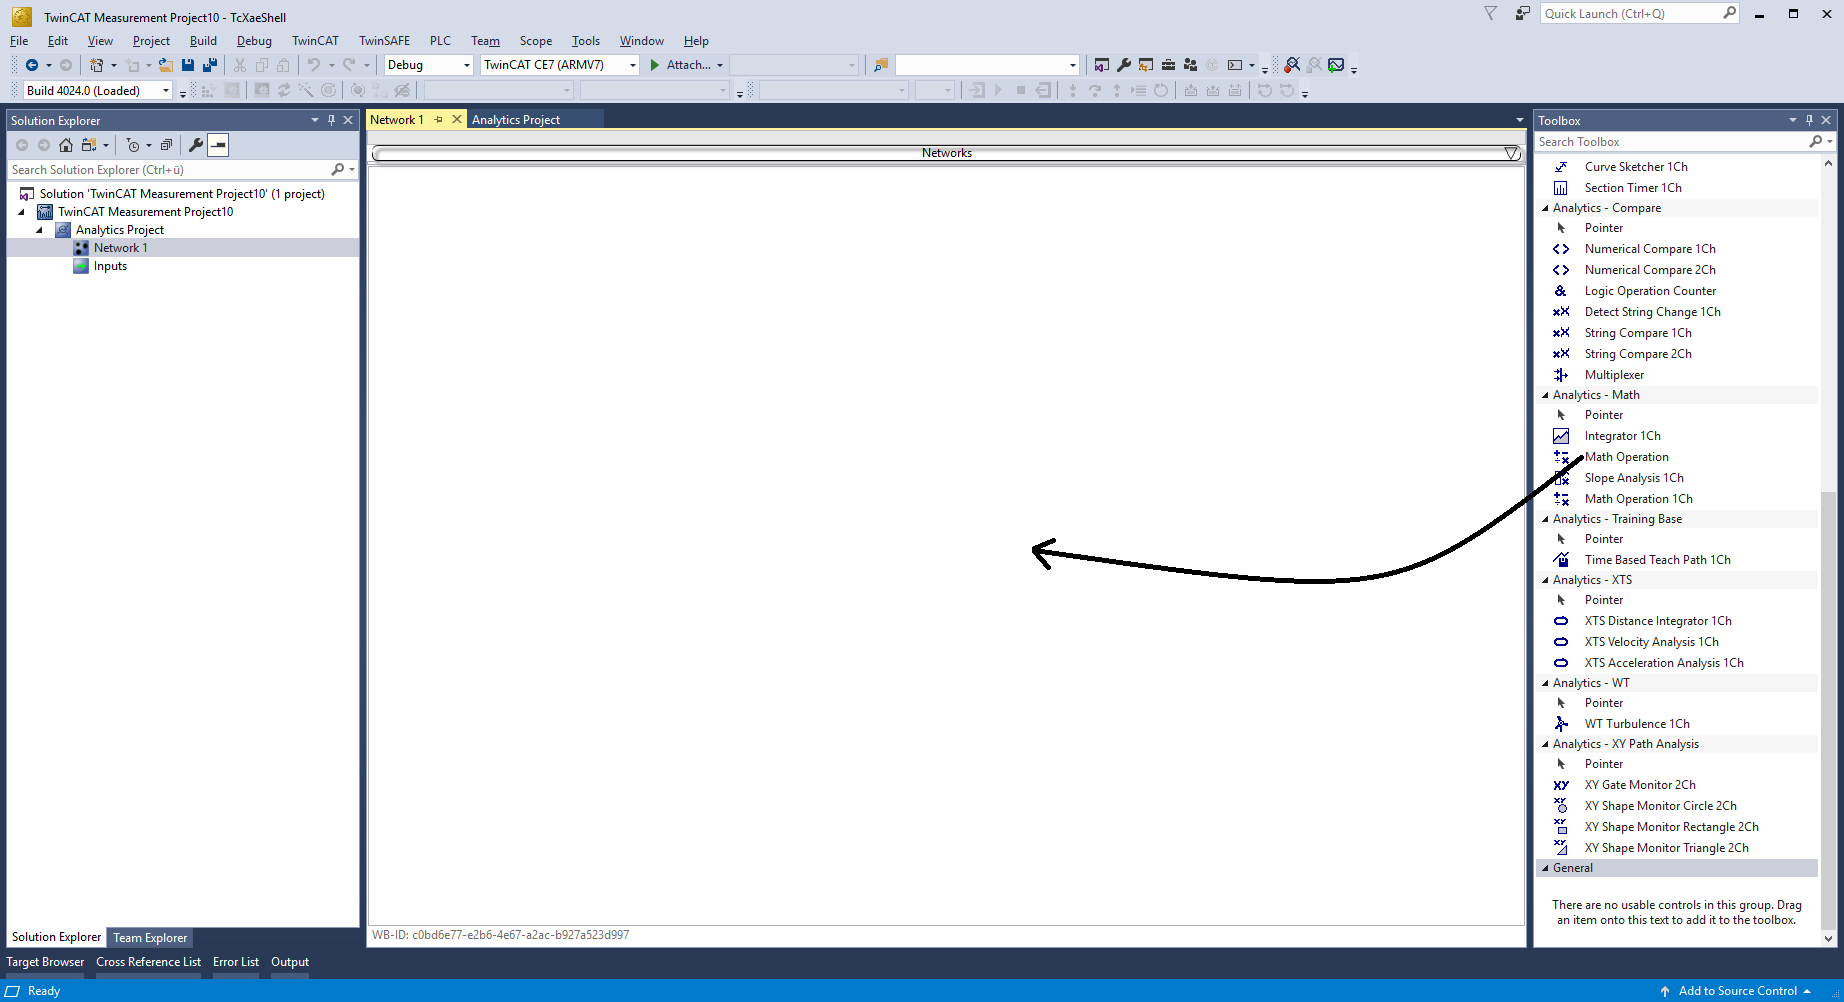
- 5. After selecting the algorithm, you need to connect input variables to the modules (algorithm). To do this, open the Target Browser.
TwinCAT > Target Browser > Target Browser
- 6. Now select the TcAnalytics or TcAnalyticsFile tab in the Target Browser. Continue with the tab TcAnalytics (MQTT).
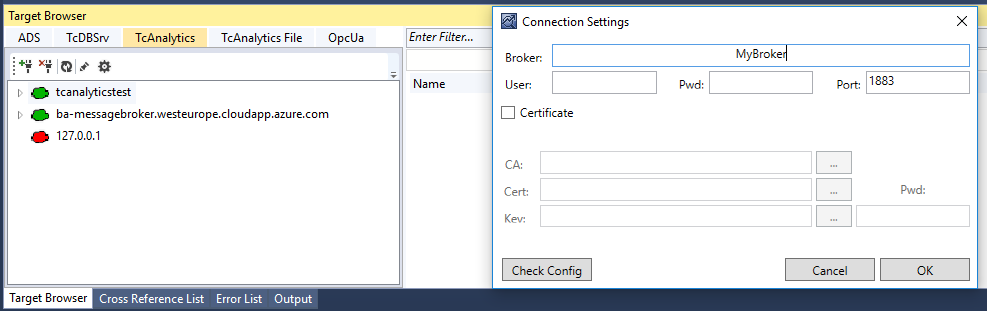
- 7. Click the icon highlighted in green in the toolbar of this Analytics extension. A window opens in which you can specify the connectivity data of your message broker.
- 8. Select your MQTT Analytics client (TwinCAT Analytics Logger, TwinCAT IoT Data Agent or Beckhoff EK9160). There is a unique ID for each control. This ID is displayed in the Target Browser.
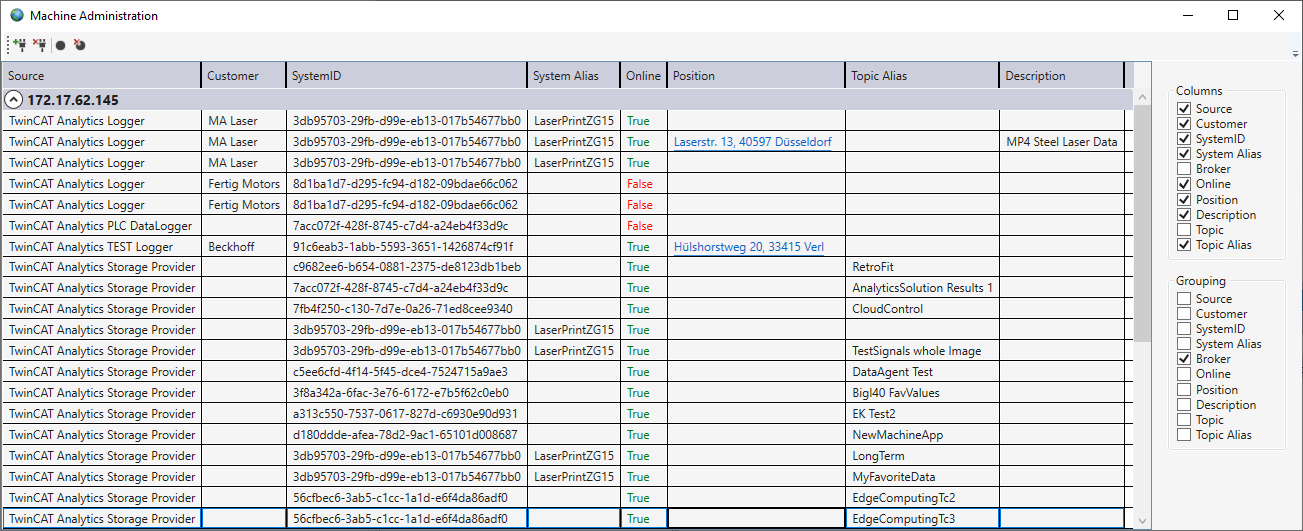
- 9. Clicking on the gear icon, you will get to the Machine Administration page. Here you can assign a system alias name that will be displayed in the Target Browser instead of the ID.
- 10. In the next step, you can choose between live data and historical data for each MQTT Analytics client. In this case, the historical data is provided by the TwinCAT Analytics Storage Provider.
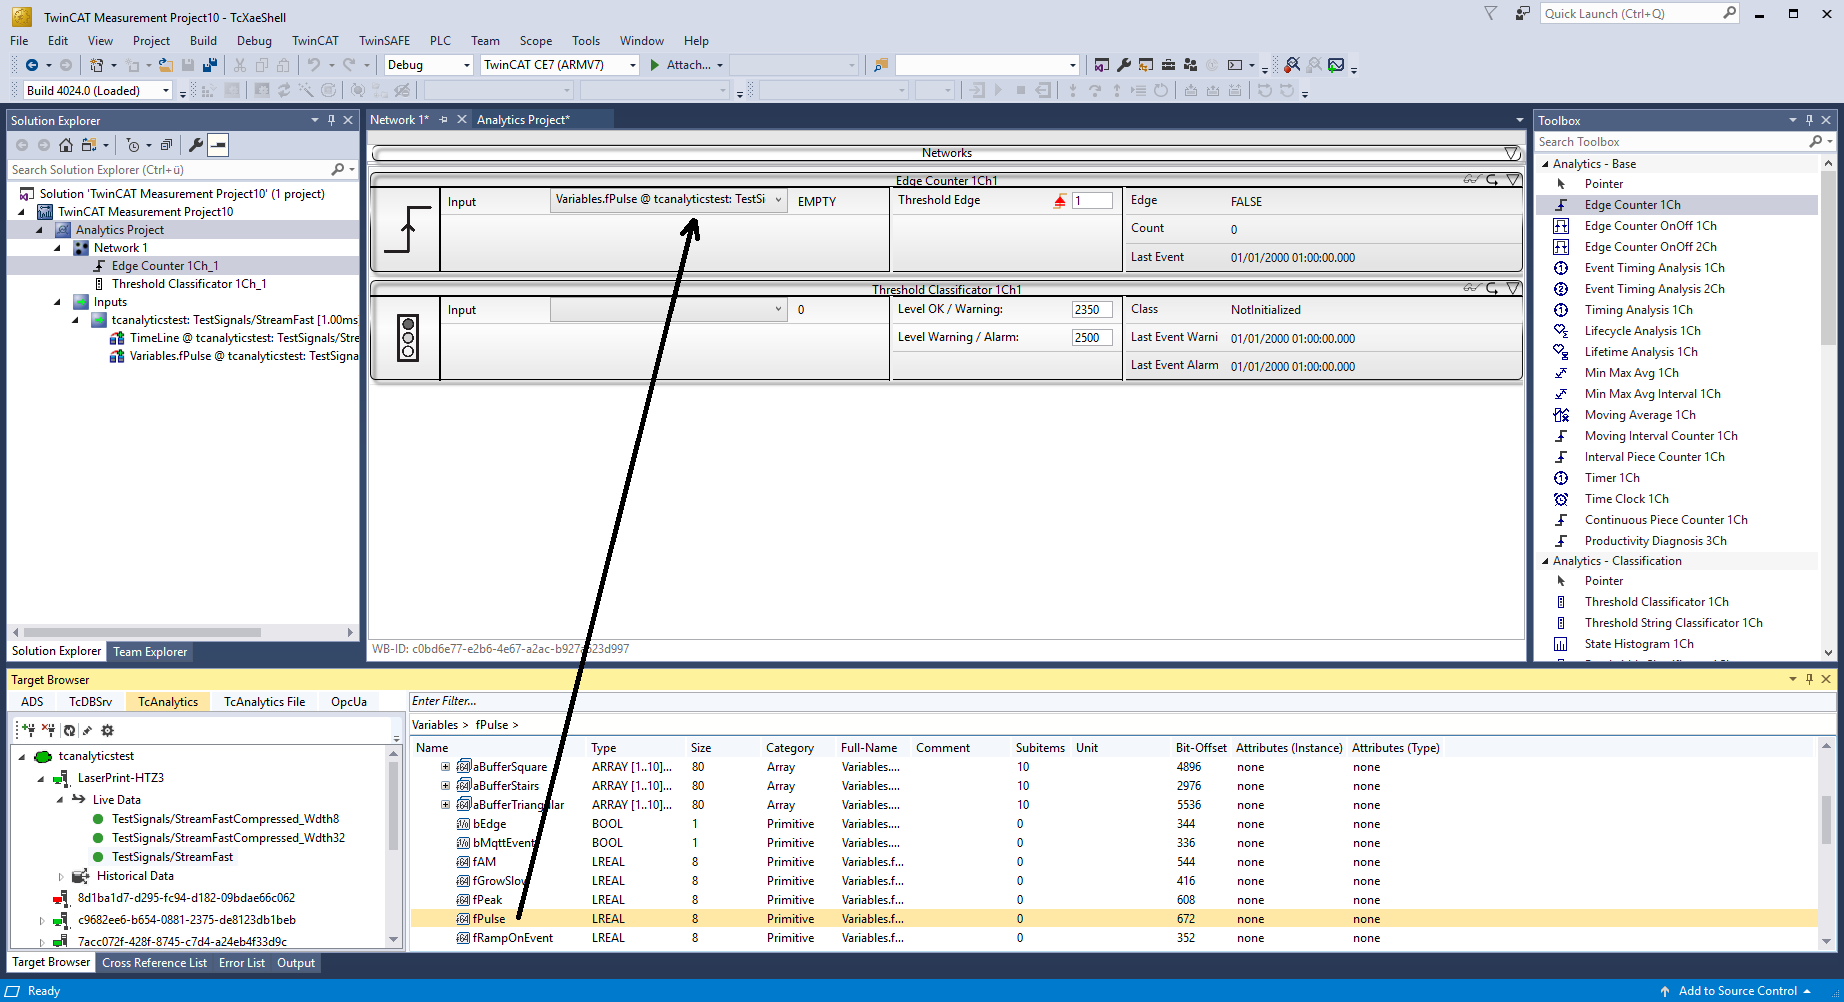
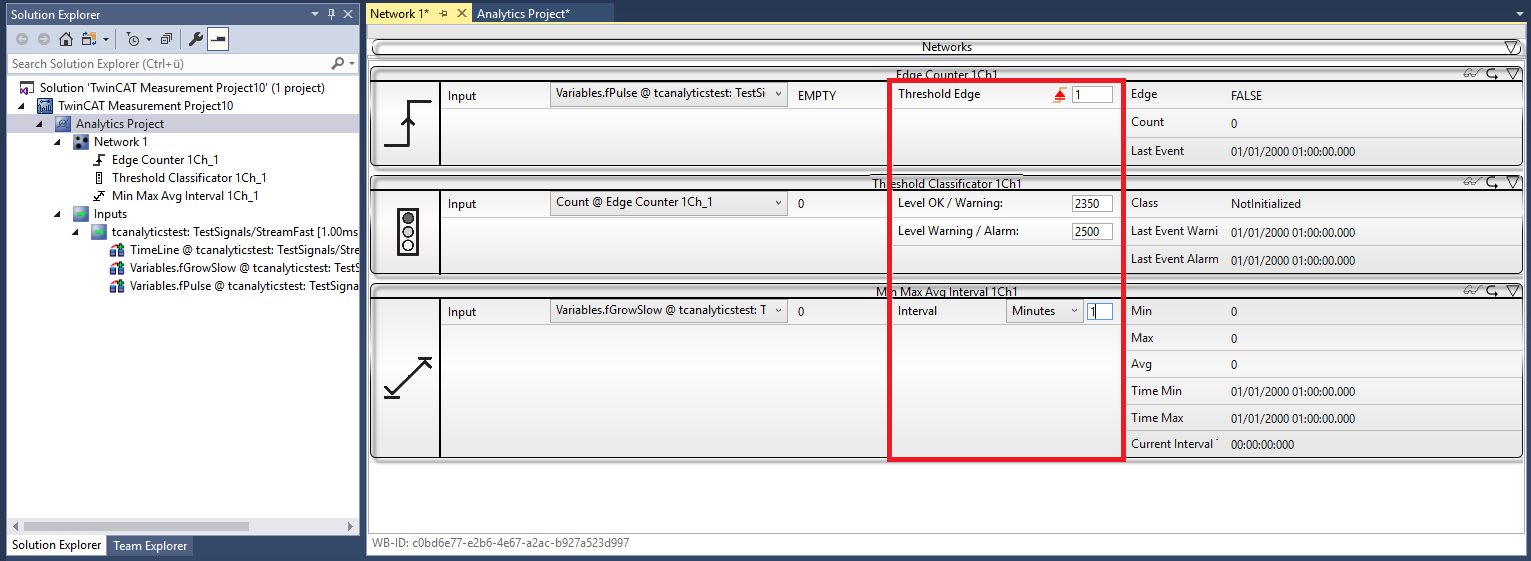
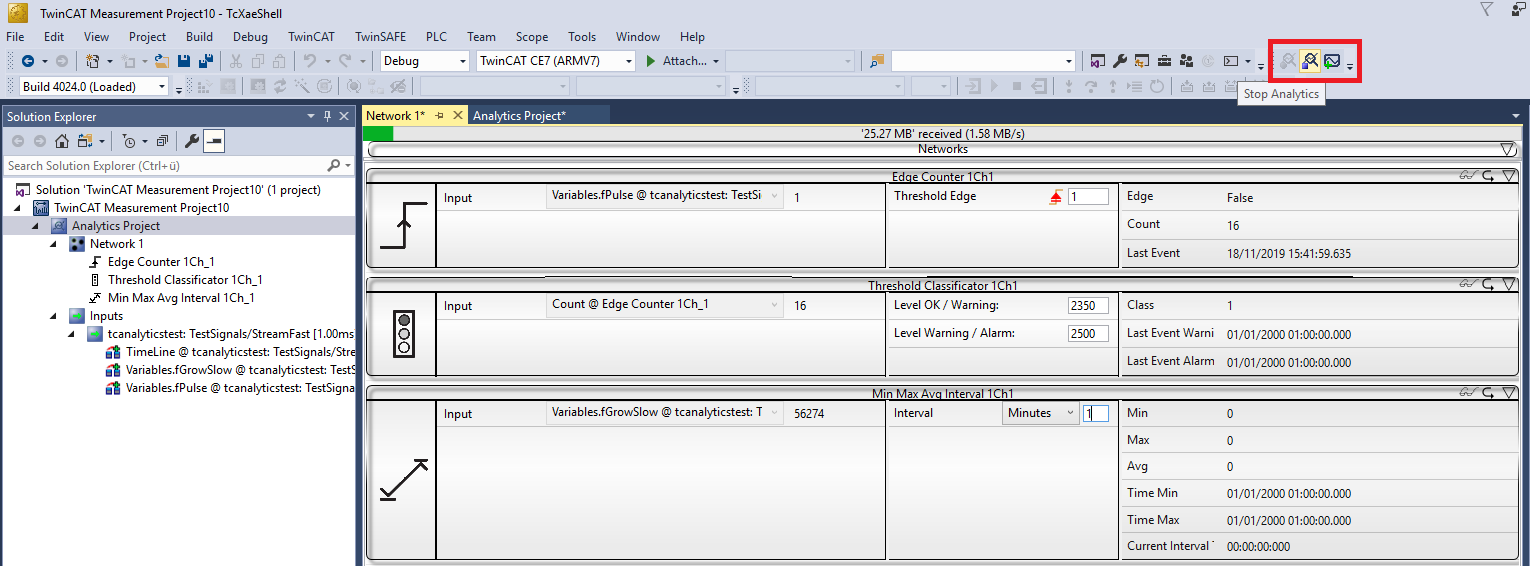
- 11. You can drag and drop the variables into the inputs of the specific algorithm. In most algorithms, conditions such as thresholds, time intervals, logical operators etc. can be specified. These settings are made in the middle of each module.
- Finally, your first Analytics Project is complete. To start the analysis, click Start Analytics. To stop the analysis, click Stop Analytics.
- Before starting the analysis or during runtime, you can click the Add Reference Scope button. This will automatically create a Scope configuration that matches your Analytics project.
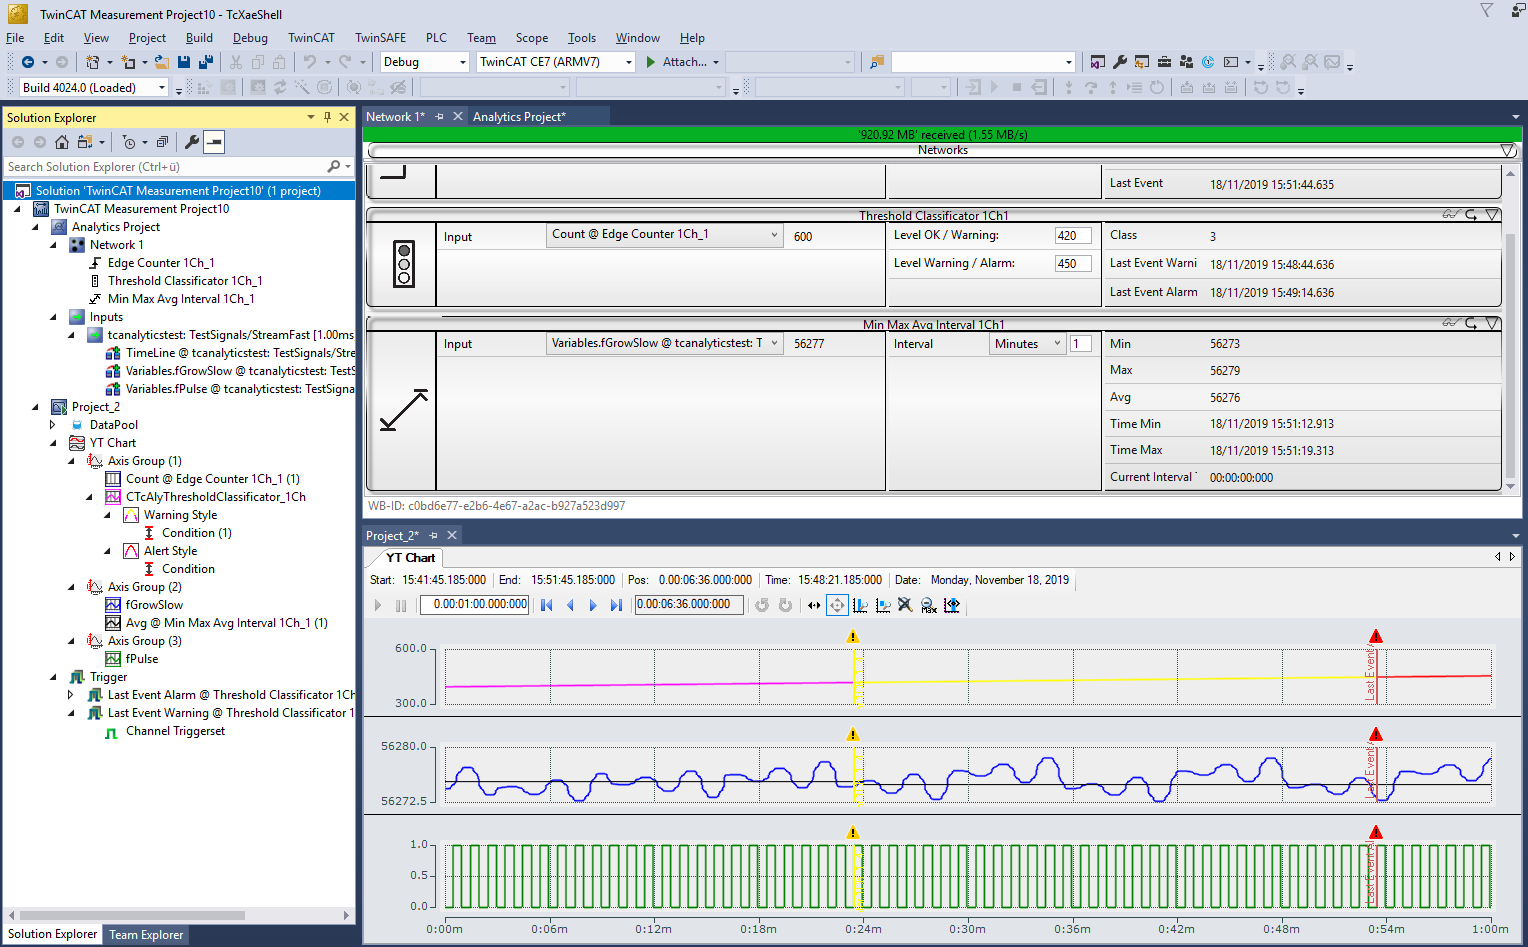
- The analysis results can be displayed in the Scope View graphs using drag-and-drop. For example, a mean value can be displayed as a new channel in the view. Timestamps as markers on the X-axes show significant values.