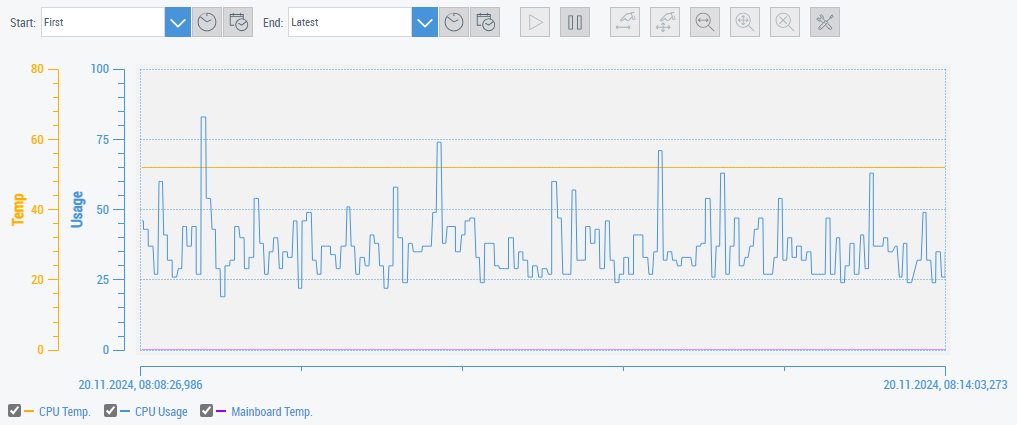
Trend Line Chart Control

The Trend Line Chart Control enables the display of the historized symbols. The Trend Line Chart Control can display several historized symbols simultaneously. In addition, time periods from the past can be displayed and the data they contain enlarged and observed in detail.

The Trend Line Chart Control is located in the Toolbox under the category Beckhoff, from where you can insert it into an HMI page by drag-and-drop.

Trend Line Chart Control 1:

The control offers various configuration options in the engineering and during the runtime in the browser.

Detailed view

If the live view in the Trend Line Chart has been paused, you can view individual data points with the aid of the zoom functions. Hovering with the mouse over a data point will bring up a display of detailed information on the time and data point.

Trend Line Chart Control 2:

Configuring axes

If you wish to display a historized symbol in the Trend Line Chart you must first carry out a Y-axis configuration for the symbol. Select the control and open the Properties window, where you select the property Y Axis under the category Y Axis. An editor then opens that enables the configuration of a Y-axis as well as the addition of further axes. Configure the axis according to the settings that you need for the historized symbol (e.g. min. and max value on the Y-axis).

Trend Line Chart Control 3:

Then confirm the dialog with OK and open the descriptions of the chart (LineGraphDescriptions) in the category Common in the Properties window, where the configured Y-axes are linked with the historized symbols. Add a new description and select the historized symbol as well as the associated Y-axis. The available historized symbols or Y-axes respectively are displayed in the comboboxes.

Trend Line Chart Control 4:

Confirm the dialog with OK. You can then start the LiveView or publish the project on a server and view the historized symbol in the chart.

Configuring the interval time

You can configure the update rate of the control in the Trend Line Chart Control. The update rate can be found under the entry Interval in the category Common. The update rate is specified in milliseconds.

Trend Line Chart Control 5:
Trend Line Chart Control 6:

If you have a historized symbol with an update rate of 100 ms, you should also set the update rate of the control to 100 ms, as otherwise the control will be updated, for example, at 1-second intervals, even though your data are already available every 100 ms.

Configuring the time period

The start and end times of the historized data displayed can be configured in the control's Properties window. The times can be specified as time interval, point in time or "First or Latest" respectively.

Trend Line Chart Control 7:

In addition, it is possible to set the start and end times of the historized data displayed in the browser for each client (see menu bar).

Trend Line Chart Control 8:

Menu bar

The Trend Line Chart Control has a menu bar that can optionally be displayed under the properties of the control (ShowMenuBar in the category MenuBar). The menu bar enables the analysis of the data at runtime in the browser:

Trend Line Chart Control 9:
  1. Start time: Start time of the historized data displayed (First for the beginning of the recording).
  2. Select time interval: Select the time interval for the start time (e.g. two minutes before the last value).
  3. Select point in time: Select point in time for the start time (e.g. 6/16/2018 at 5:53 pm).
  4. End time: End time of the historized data displayed (Latest for the last recorded value).
  5. Select time interval: Select the time interval for the end time.
  6. Select point in time: Select the point in time for the end time.
  7. Start live view: The live view can be started after pausing the live view.
  8. Pause live view: The live view can be paused in order to view data points in greater detail.
  9. Shift data on the X-axis: The data displayed can be shifted on the X-axis if the live view has been paused.
  10. Shift data on the X and Y-axes: The data displayed can be shifted on all axes if the live view has been paused.
  11. Zoom X-axis: When this button has been activated you can zoom in on the X-axis with the aid of the mouse.
  12. Zoom X-Y-axis: When this button has been activated you can zoom in on both axis equally with the aid of the mouse.
  13. Reset Zoom: This button resets all zoom settings.

Further configuration options

Further configuration options for the Trend Line Chart Control can be found here.

Example

An example of the use of the historized symbols in interaction with the Trend Line Chart Control: Example.
The example shows two historized symbols (the associated TwinCAT project is included) and the associated configuration in the Trend Line Chart Control.