Example:
Procedure to load measured values and to design a correspondingly adapted characteristic curve
- 1. First, create a new Slave under the already existing Master.
- 2. Read in the measured values with the Import command on the Properties page of the Slave.
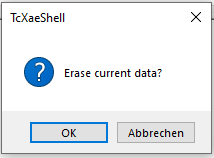
- 3. Confirm the prompt regarding deleting the current data with OK.
- The data are loaded.
Adapting the graphic window
- 1. In the toolbar
 , click Adaptation to extreme values.
 - 2. The graphic window is adapted to the data read in.
- 3. The measured data is represented as a cubic spline.
- 4. If the variation in the measured value is too large, this can result in overshoots in the display.
- 5. Manually change the function type in the table.
- The behavior in the table can be changed in this way.
Creating a characteristic curve
- 1. Add a new Slave. OR:
- 2. Switch to the already existing Slave that is to be modified.
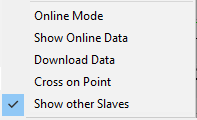
- 3. Right-click inside the graph and place the measured values in the background with the command Show other Slaves.
- 4. Move the points and adapt the current characteristic curve to these measuring points, if necessary by zooming into it.
- The measuring points will not normally fill out the entire range of the characteristic curve. The current characteristic curve extends beyond the measured values. If you have several measurements, you can save each one in a separate Slave.
Hiding unneeded measurements
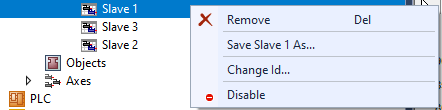
- 1. Right-click the Slave in the tree view.
- 2. Click Deactivate.