Introduction
The graphically-oriented Valve Diagram Editor, which is similar to the cam plate editor, is used to design the characteristic curve of a hydraulic valve.
The Valve Diagram Editor is integrated in the XAE engineering environment, based on Visual Studio™. In the user interface it can be found under the System Manager (see diagram).
The valve characteristic curves designed are stored in the respective project file. On starting the system, the characteristic curves are automatically transferred to the eXtended Automation Runtime (XAR).
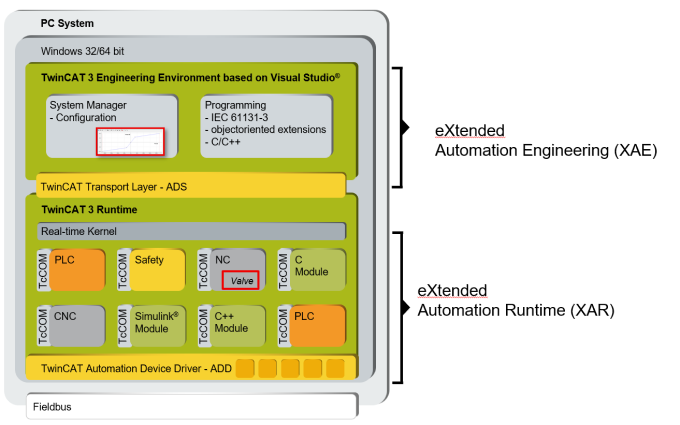
eXtended Automation (XA) architecture
Information about the TF5050 PLC library can be found here.
 | The appropriate license is required for full use of the TE1500 Valve Diagram Editor, see Licensing. |
Starting the Valve Diagram Editor
The Valve Diagram Editor integrated in TwinCAT 3 can be found in the TwinCAT project created under MOTION > Tables.
- 1. In the dialog box, select the type of Master: Valve characteristic curve.
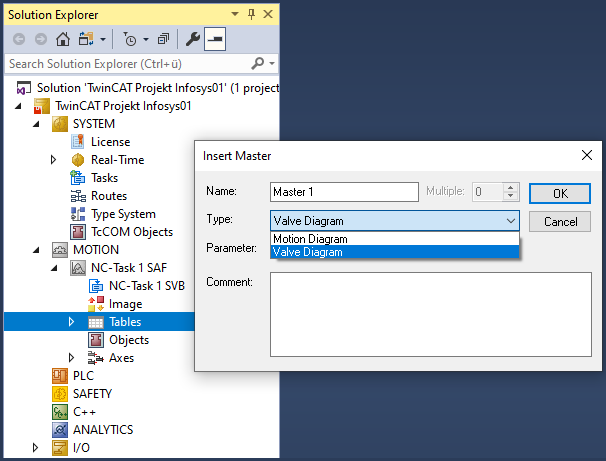
Here you can insert additional Masters and below that corresponding Slaves by right-clicking.
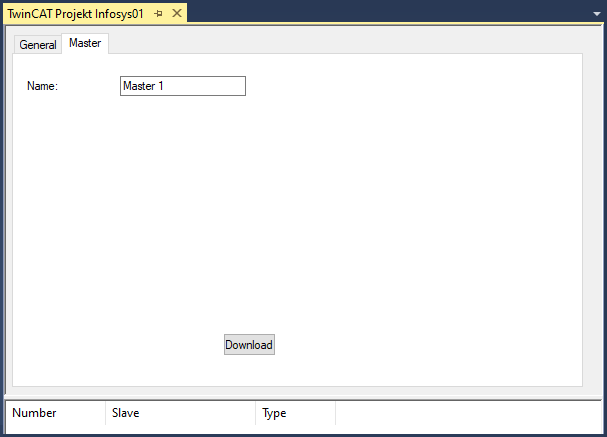
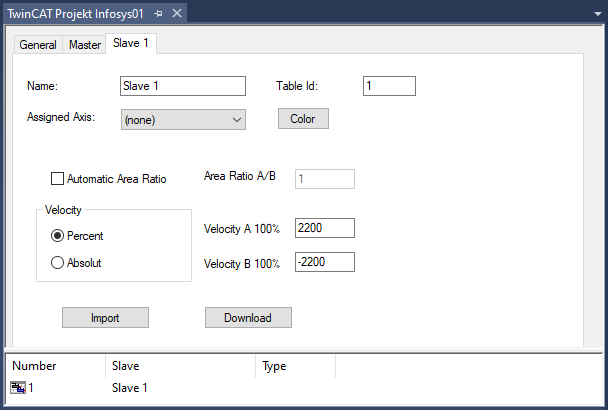
- 2. Click the Master in the structure tree to open the property pages.
The structure of master and slave originates in the cam plate editor. Its advantage here is that measurements can be placed into a separate slave, and that these can then be used as a graph in the background for the construction of an idealized characteristic curve.
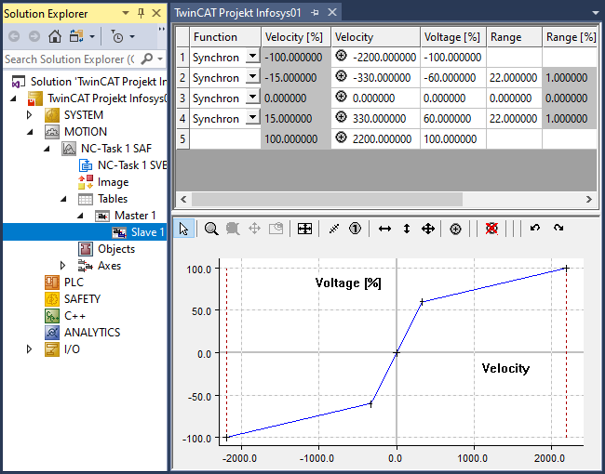
The user's interface to the Valve Diagram Editor is largely graphical. Following interactive graphic entry of the points in the graphic window, the co-ordinates of the points are displayed in the table window above it. New points can only be inserted in the graph, and it is only possible to delete existing points via the graph. The properties of the points - the co-ordinate values - can also be interactively manipulated in the table window. The points are usually joined to one another by straight lines.
The straight line transitions are smoothed by entering a transition area (Range) (see graphic below). The range can only be modified through the table window.
The cross that displays the intersections of the straight lines is adapted horizontally to the range.
The graphic area allows display not just of the voltage against the velocity, but also of their derivatives.
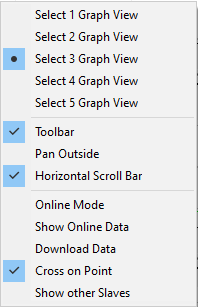
Change display
- The mouse pointer is in the graphic window.
- 1. Right-click.
- 2. Select the desired views in the menu window.
- A separate graphic window is thus created for each derivative.