Sample Array Marker
The use of markers in a ScopeProject using an array bar chart is explained below.
In this sample the programming language C# is used.
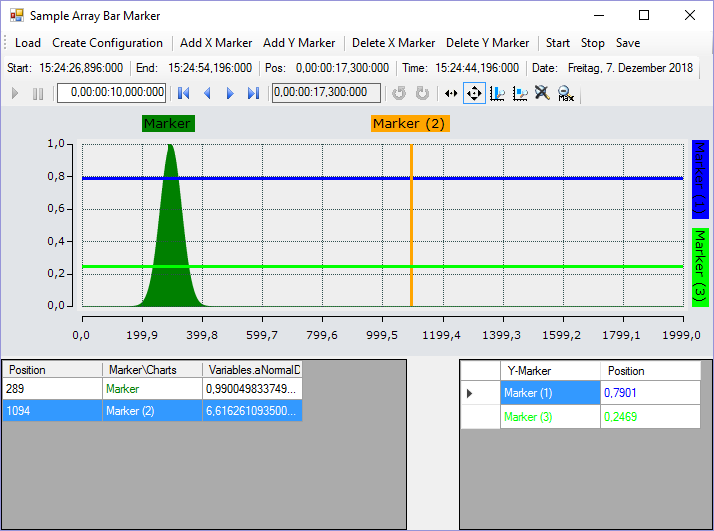
First, a Windows Forms application is created. Use the toolbox to add a toolbar and the buttons shown above to the form. A ChartPanel is subsequently inserted and the "Dock" property is set to "Fill" so that the graph completely fills the window. Apart from that the marker values are to be illustrated in tables. To do this, two DataGridView elements must be added to the form. The two columns "Y-marker" and "Position" have to be added to the DataGridView on the right. To do this, click on Browse in the "Columns" row in the Properties window to open the dialog Edit Columns. You can then use Add to create new columns. The header text corresponds to the displayed column header.
The code behind the Load and Create Configuration buttons largely corresponds to the code from the sample of the array bar chart. All you have to do is create an additional column for the channel in DataGridView.
private string filename = @"..\..\ScopeTestYTMarker.tcscopex";
ScopeProject scopeProject = new ScopeProject();
AxisGroup axisGroup
{
    get
    {
        if (scopeProject.SubMember.OfType<Chart>().Count() == 0) return null;
        return scopeProject.SubMember.OfType<Chart>().First().SubMember.OfType<AxisGroup>().First();
    }
}
private void btnLoad_Click(object sender, EventArgs e)
{
    FileInfo fInfo = new FileInfo(filename);
    if (!fInfo.Exists)
    {
        MessageBox.Show("File not found! Please use the Add Chart button to create a config! Once a config is created and saved it can be load using the Load button!", "File not found",
        MessageBoxButtons.OK, MessageBoxIcon.Exclamation);
    }
    else
    {
        //delete old configuration
        scopeProject.Dispose();

        //load new configuration
        scopeProject = ScopeProject.LoadScopeProject(filename);
    }
    chartPanel.ModelChart = scopeProject.SubMember.OfType<Chart>().First();
}
Create Configuration is a combination of the familiar buttons Add Chart, Add Axis and Add Channel.
private void btnCreateConfiguration_Click(object sender, EventArgs e)
{
    //Add Chart
    ArrayBarChart chart = new ArrayBarChart();
    scopeProject.AddMember(chart);

    //Add Axis
    AxisGroup axisGroup = new AxisGroup();
    chart.AddMember(axisGroup);

    //Add Channel
    Channel channel = new Channel();
    axisGroup.AddMember(channel);
    SetAcquisitions(channel);
    AdsAcquisition acquisition = (AdsAcquisition)channel.SubMember.OfType<AcquisitionInterpreter>().First().Acquisition;
    dataGridView1.Columns.Add(acquisition.SymbolName, acquisition.SymbolName);

    chartPanel.ModelChart = chart;
}

private void SetAcquisitions(Channel channel)
{
    AdsAcquisition acq = new AdsAcquisition();
    acq.AmsNetId = AmsNetId.Local;
    acq.TargetPort = 851;
    acq.IsSymbolBased = true;
    acq.SymbolName = "Variables.aNormalDistribution";
    acq.DataType = DataTypeConverter.AdsToScope2Datatype(AdsDatatypeId.ADST_INT16);
    acq.SampleTime = (uint)(100 * TimeSpan.TicksPerMillisecond);
    acq.ArrayLength = 2000;
    acq.Oversample = 2000;
    AcquisitionInterpreter acquisitionInterpreter = new AcquisitionInterpreter();
    acquisitionInterpreter.Acquisition = acq;
    channel.AddMember(acquisitionInterpreter);
}
The sample developed here is available as a VS project: Project
The variables refer to the TwinCAT program behind the following file: MeasurementSamplePLC.zip